System Configuration & Testing
To test Delta MAX, we placed it on our bench as a secondary drive. The specifications of our system are as follows:
- CPU: i9 9900K
- Motherboard: Gigabyte Z390 Aorus Pro
- RAM: 2 x 8GB Corsair Dominator Platinum RGB @ 3200MHz
- GPU: MSI GTX 2060 Super
- OS Drive: Crucial P1 1000GB
- OS: Window 10 Professional X64
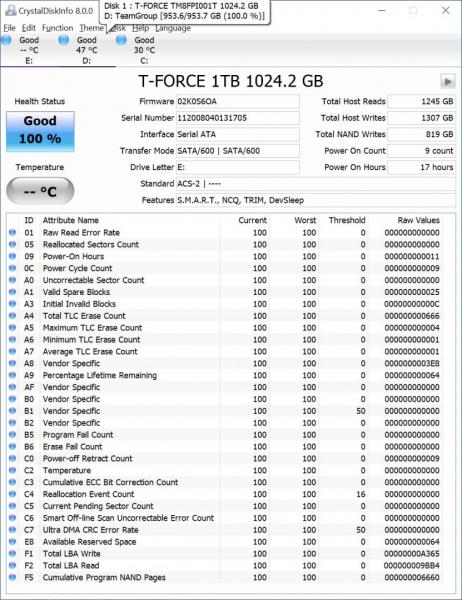
Before I started running some benchmarks on the drive, I used CrystalDiskInfo to check out some details of the Delta MAX. One difference we noticed was that the Delta Max White Edition didn’t report its temperature like the Black Edition we reviewed. This isn’t a concern as SSD temperature is rarely an issue, but figure it’s something that should be noted.
I will be running the drive through various benchmarking applications to see how it fairs under different workloads. These applications include:
- ATTO Disk Benchmark
- CrystalDiskMark 6.0
- Anvil’s Storage Utilities
- AS SSD
ATTO Disk Benchmark
“As the industry’s leading provider of high-performance storage & network connectivity products, ATTO has created a widely-accepted Disk Benchmark freeware utility to help measure storage system performance. As one of the top tools utilized in the industry, Disk Benchmark identifies performance in hard drives, solid-state drives, RAID arrays as well as connections to storage. Top drive manufacturers, like Hitachi, build and test every drive using the ATTO Disk Benchmark”.
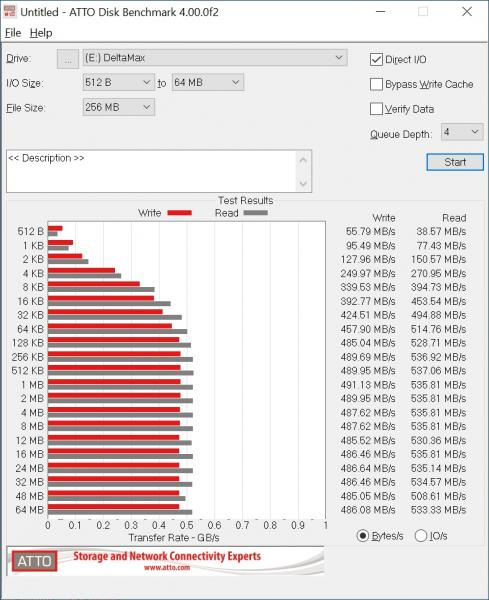
ATTO shows us a peak write performance of 489MB/s and read performance of 537 MB/s. This is pretty much in line with the advertised write performance of 510MB/s and read performance of 560MB/s of the Delta Max.
CrystalDiskMark 6.0
“CrystalDiskMark is designed to quickly test the performance of your hard drives. Currently, the program allows measuring sequential and random read/write speeds.”
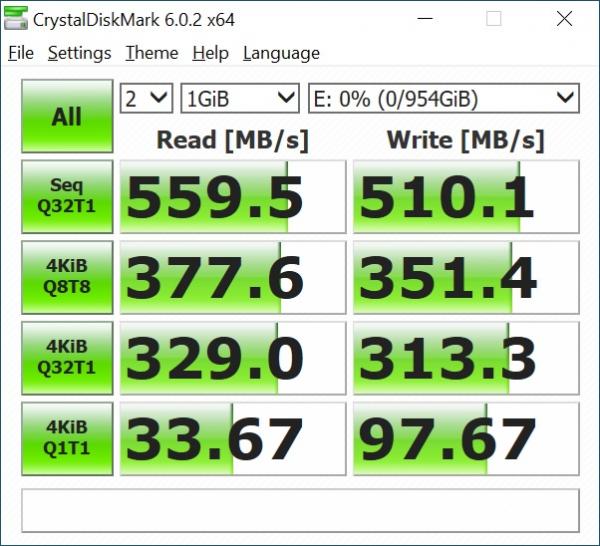
In CrystalDiskMark, the Delta MAX White Edition pretty much matches its specification with 559MB/s read and 510MB/s write.
Anvil’s Storage Utilities
“Anvil’s Storage Utilities is a powerful tool that was designed to provide you with a simple means of assessing the read and write performance of your Solid State Drive or Hard Disk Drive.
The benchmark tool helps you monitor and check the response time of your unit as well as view the system information collected using Windows Management Instrumentation (WMI).
Anvil’s Storage Utilities has been designed to be the most comprehensive benchmark tool for Solid State Drives on the market. That does not mean that you can’t use it for conventional platter-based drives as well, but you do get the most out of the program when you test the speed and performance of SSDs with it. The program has gone through a series of beta and release candidate builds already and is currently available as Release Candidate 3. It is usually linked from this forum thread, which currently is not the case for the RC build which you can download here directly. You can’t use previous builds as they are set to expire automatically.
You can run a benchmark right away by selecting a drive from the menu at the top right or check out the settings first to make sure everything is configured correctly here. Here you can simulate a compression level of the text file, e.g. database, application, or uncompressed, and whether you’d like to use the same test file on consecutive runs or generate a new one every time. As far as benchmarks go, you can run a standard SSD benchmark that is testing read, write, or both performances of the drive, or run threaded IO benchmarks only.”
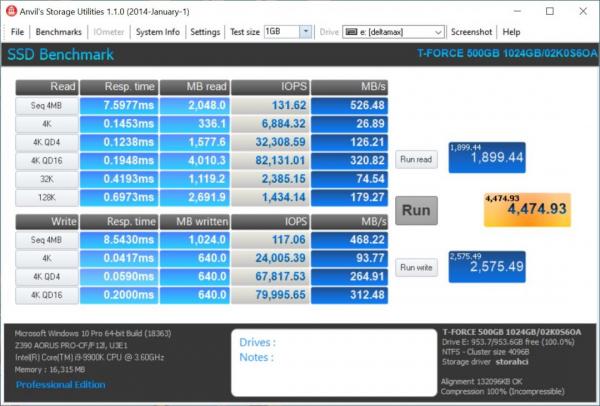
Anvil is showing our sequential read/write speeds as well as 4K random read/write a little lower than you would expect, but that’s typical for this benchmark.
AS SSD
“The AS SSD benchmark determines the performance of Solid State Drives (SSD). The tool contains six synthetic and three copy tests.
The synthetic tests determine the sequential and random read and write performance of the SSD. These tests are carried out without using the operating system cache. In Seq-test the program measures how long it takes to read a 1 GB file to write respectively. 4K test the read and write performance is determined at random 4K blocks. The 4K-64 corresponds to the test Third 4K procedure except that the read and write operations are distributed to 64 threads.
This test should SSDs pose with Native Command Queuing (NCQ), differences between the IDE operation mode where NCQ is not supported, and the AHCI mode. The additional compression test can measure the power of the SSD in response to the compressibility of the data. This is especially for the controllers that use to increase the performance and life of the cell compression, important.
In the first three synthetic tests and the compression test, the size of the text file 1 GB. Finally, the access time of the SSD is calculated, wherein the access to read over the entire capacity of the SSD (Full Stroke) is determined. The write access test, however, is done with a 1 GB big test file.”
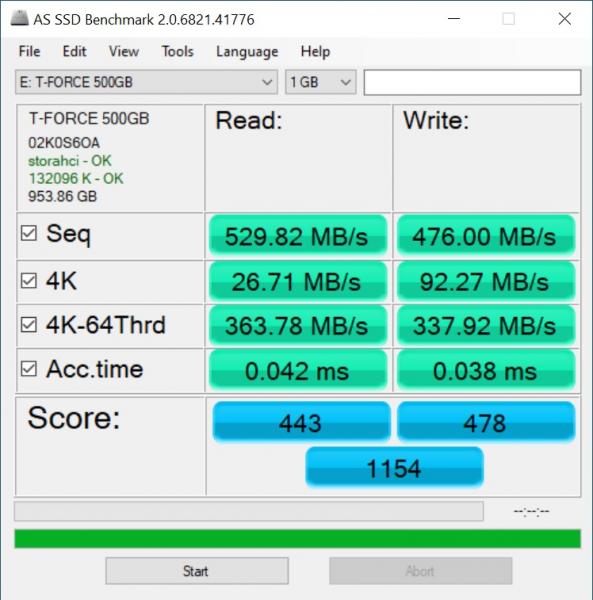
Speeds are right where we expect them to be for this benchmark since, like Anvil, it also tends to report lower speeds than we see in CrystalDiskMark.
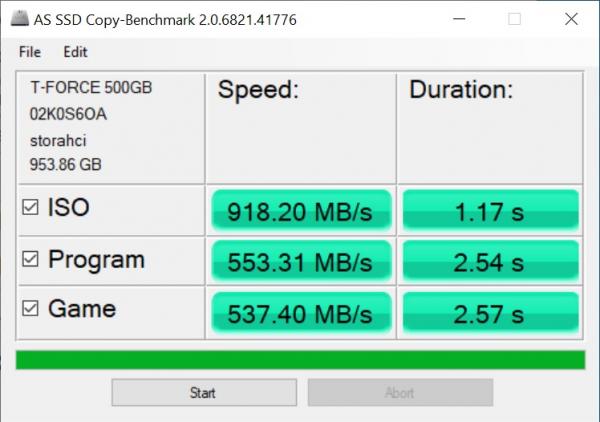
In the second benchmark, the Delta Max posts some great numbers, specifically with 918MB/s in the ISO test.
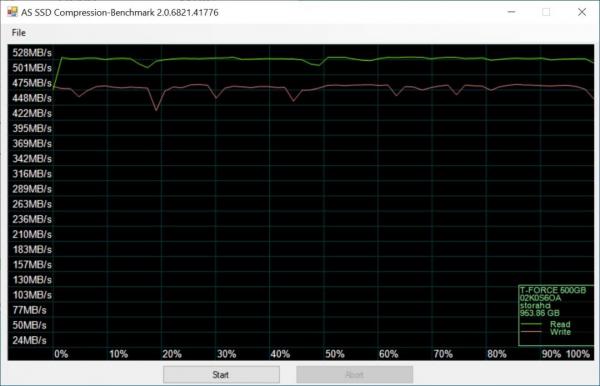
Examining the AS SSD compression benchmark, we see a steady read speed of around 528MB/s and a write speed between 422MB/s and 475 MB/s.



Check Out Our Amazon Store with Modders Inc
Please Support PCTestBench as Every Purchase Helps