Workstation & Productivity Testing
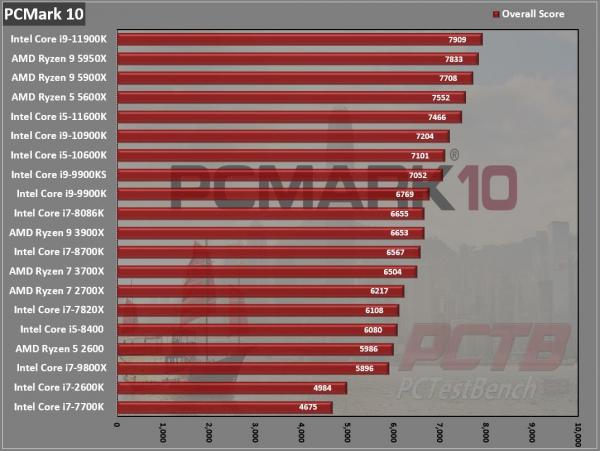
PCMark 10
PCMark 10 replicates many common tasks an office user might do such as manipulating photos, video conferencing, and spreadsheet editing and the 11900K holds first place overall in our list, even against the latest AMD chips.
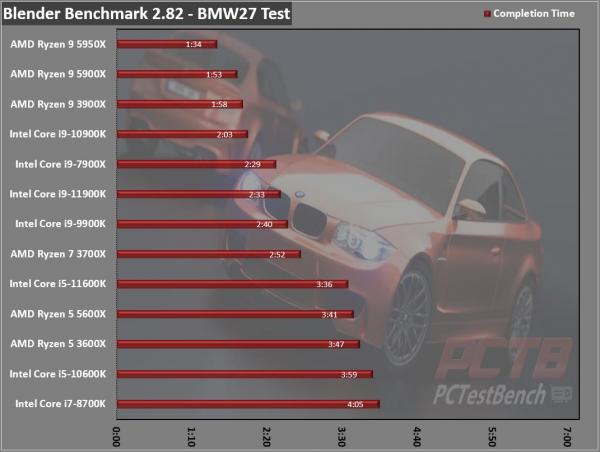
Blender Benchmark 2.82 – BMW27
A new platform to collect and display the results of hardware and software performance tests. Aimed at an optimal comparison between system hardware and installations using open source software and testing content in the public domain.
Blender can take full advantage of multiple cores so our breakdown here almost perfectly reflects core counts rather than raw performance.
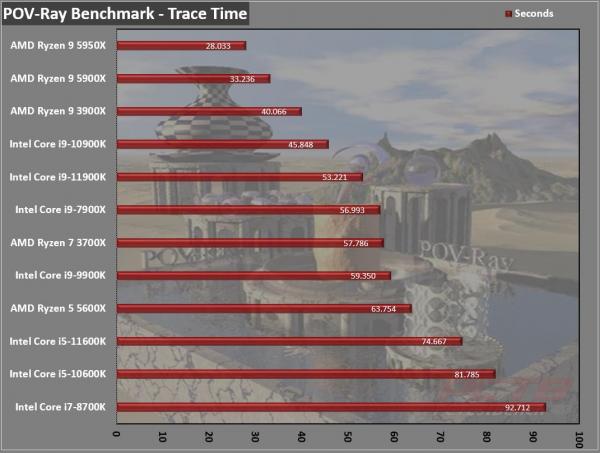
POV-Ray 3.7 Standard Benchmark – CPU
POV-Ray also scales linearly with core counts though we do find the 11900K edging out the aging 10-core i9-7900X.
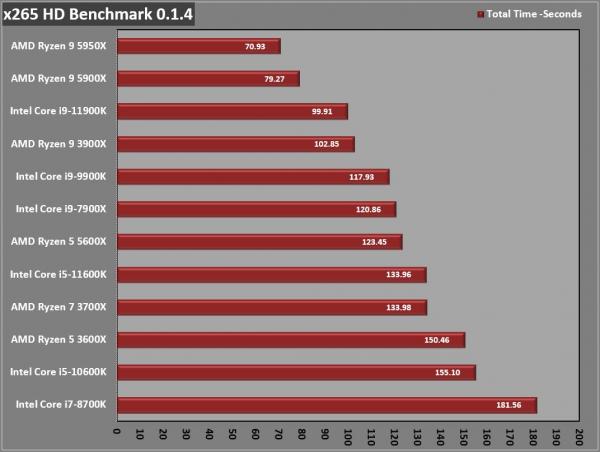
x265 HD Benchmark
A benchmark that measures how fast your computer can encode HD (1080p) video in the new H.265 / HEVC format.
Transcoding video likes core counts but doesn’t really solely on parallelization so our 11900K fights its way up into the 12-core pack pretty easily.
7-Zip
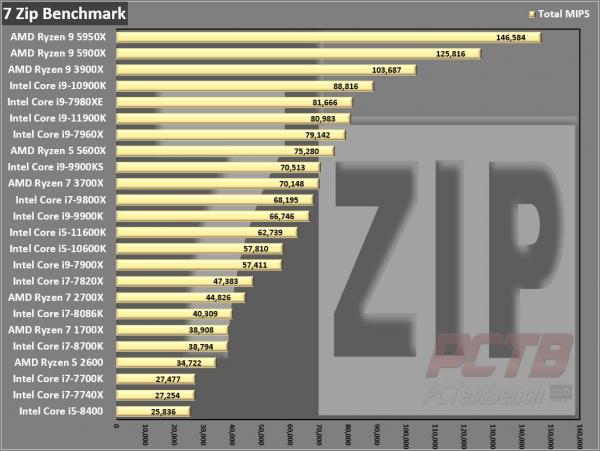
The benchmark shows a rating in MIPS (million instructions per second). The rating value is calculated from the measured speed, and it is normalized with the results of the Intel Core 2 CPU with a multi-threading option switched off. So if you have a modern CPU from Intel or AMD, rating values in single-thread mode must be close to real CPU frequency. There are two tests, compression with the LZMA method and decompression with the LZMA method. Once the total passes reach 50, the score is taken
In file compression activities, the 11900K gives an impressive show with almost 81,000 MIPS. Not quite up to the 10-core 10900K level, but going toe to toe with HEDT chips of yesterday.
WebXPRT 2015
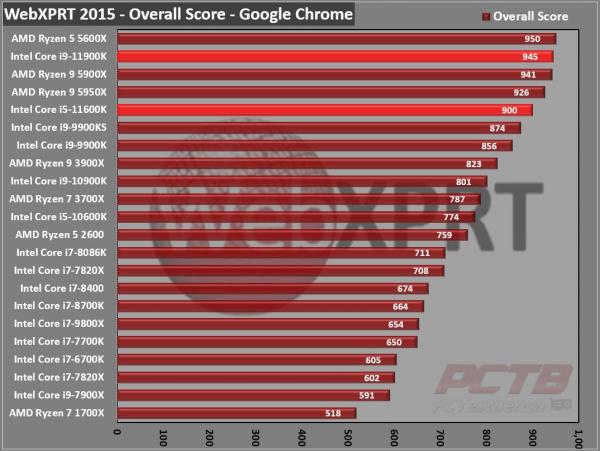
WebXPRT gives the 11900K a score of 945, the second-highest we’ve seen.



Check Out Our Amazon Store with Modders Inc
Please Support PCTestBench as Every Purchase Helps