| Component |
Product Name | Provided By |
| Processor | Intel Core i7-8700K (Retail) | Intel |
| Motherboard | Aorus Z390 Pro | Gigabyte |
| Memory | G.Skill SniperX 2x8GB @ 3400MHz 16-16-16-36 (XMP) | G.Skill |
| Drive | Samsung 240 EVO 256GB SSD, Crucial MX500 1 TB SATA III SSD | Samsung/Crucial |
| Video Cards | Gigabyte Radeon RX 5500 XT, Nvidia Geforce RTX 2080 Super, AMD Radeon RX5700XT, AMD Radeon RX 5700, Zotac Geforce RTX 2070 Mini, Nvidia RTX 2080 Founders Edition, MSI RTX 2060 Ventus | AMD/Zotac/Nvidia/MSI |
| Monitor | BenQ EL2870U 28 inch 4K HDR Gaming Monitor 3840×2160 @ 60 Hz | |
| Case | DimasTech EasyXL | DimasTech |
| Power Supply | Cooler Master Silent Pro M2 1500W | Cooler Master |
| Operating System | Windows 10 1909 x64 Pro with latest patches and updates |
Testing Methodology:
There are many ways to benchmark GPUs. With these benchmarks our goal is to do two things: first to show the performance of the card and secondly to make them easy to replicate. With a similarly configured system, you should be able to get similar results to compare your current graphics card against. There will always be a variance from system to system. All games for this review are tested with the HIGHEST IN-GAME PRESET unless otherwise specified. A fresh build of 1909 and all drivers and games were installed. No changes were made from the defaults in the BIOS, Windows 10 operating system, or provided manufactures software.
Game frame rates are averaged from the results of 3 benchmark runs at each resolution.
A few things to note –
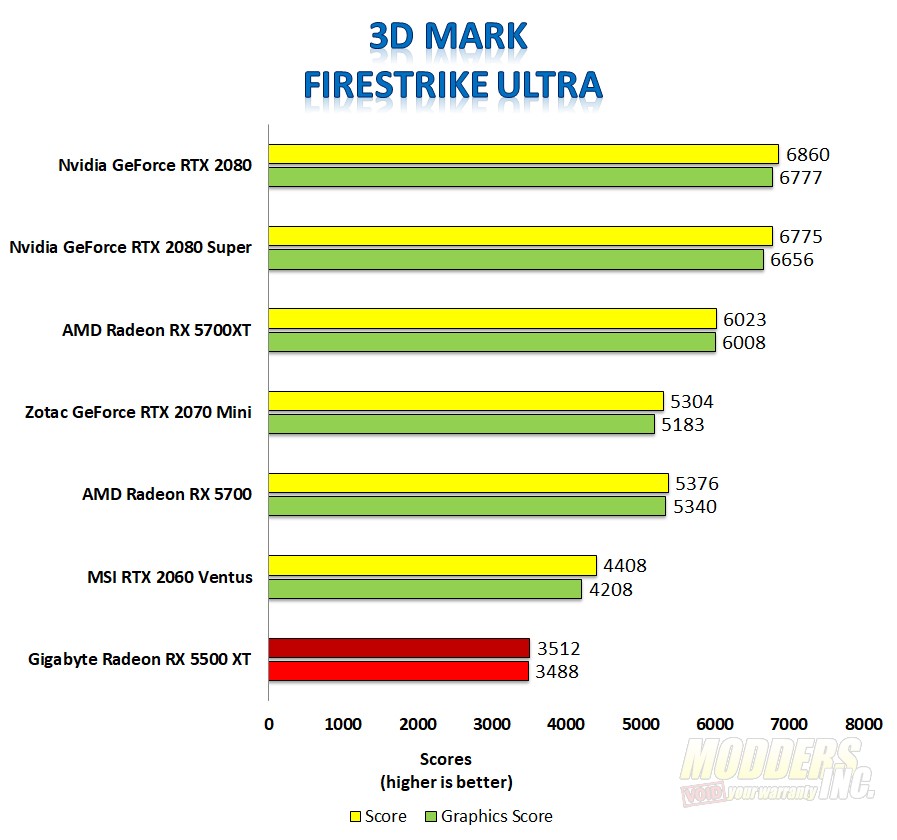
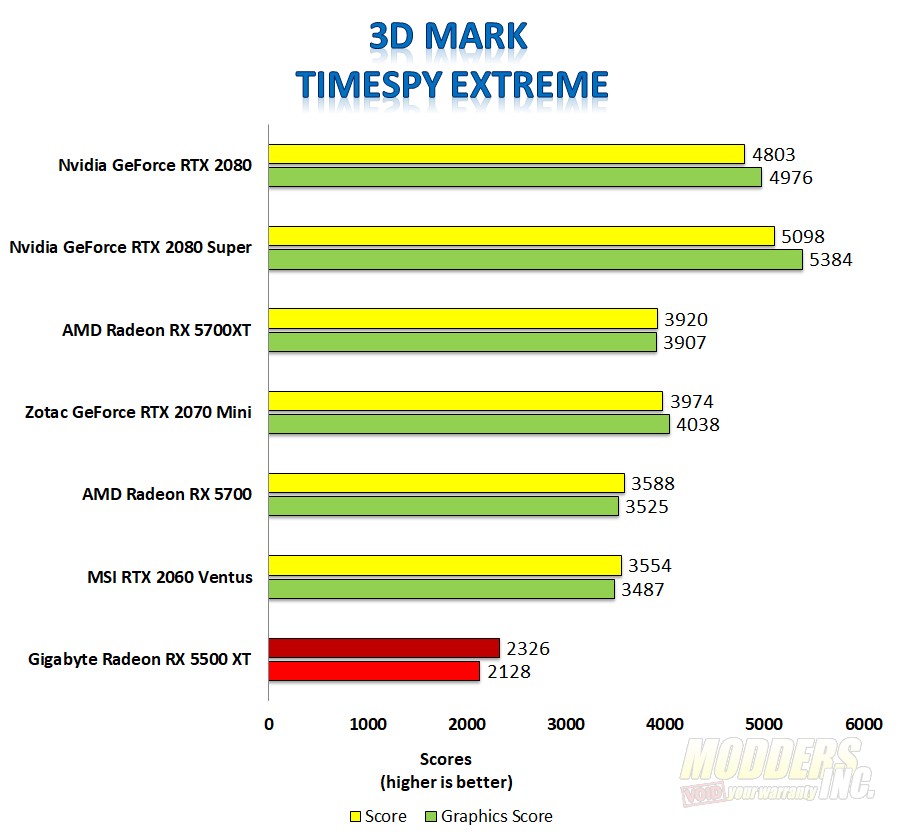
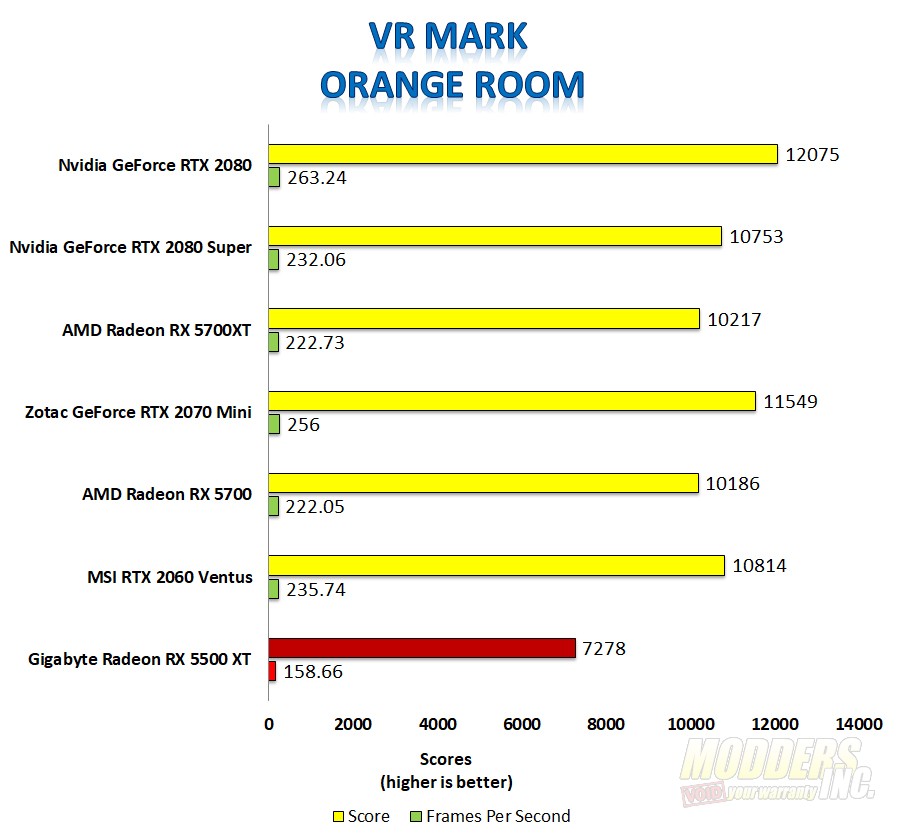
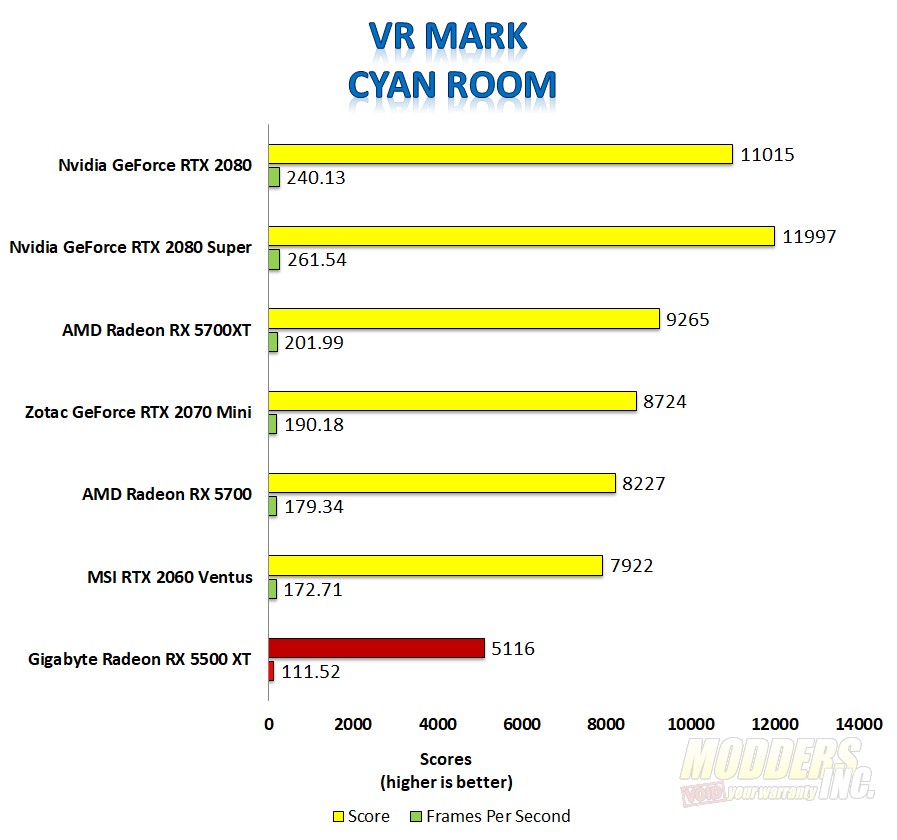
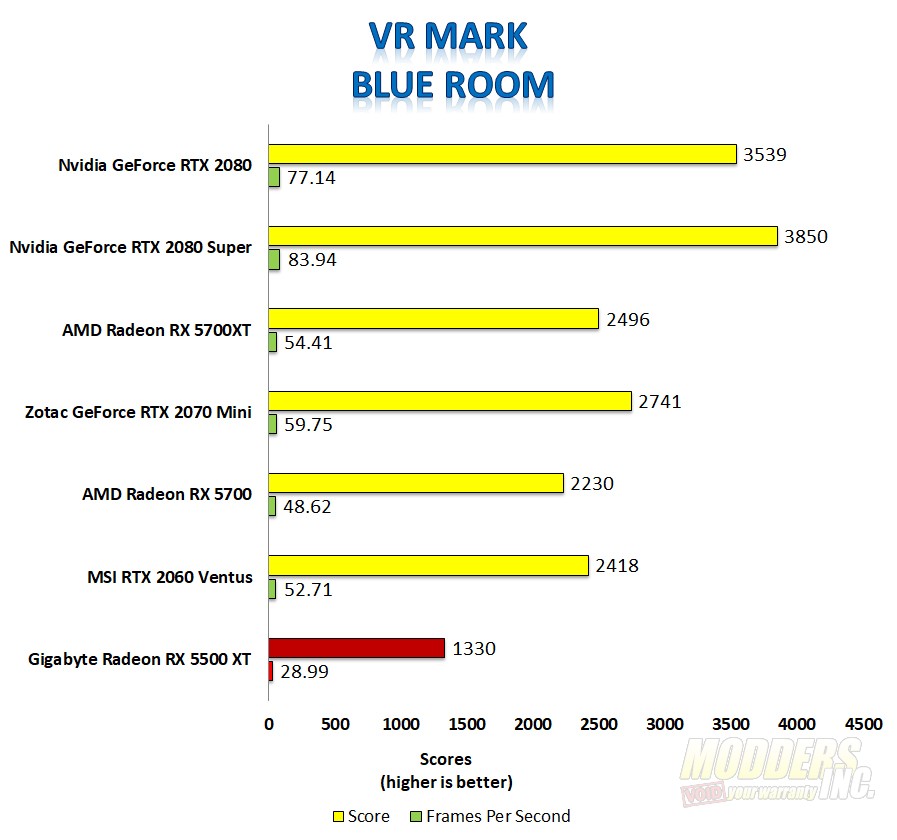
- I’ve changed the way my data is presented in the charts. I’ve included all the GPUs that I’ve tested in 2019 in the chart which includes the RTX 2080 and 2080 Super. This isn’t meant to be a direct comparison between an 800 GPU and a 300 GPU. It is meant to be more of a guide in the GPU landscape. The RTX 2080 Super shows up at the top of the chart, and the RX 5500 XT shows up at the bottom, as expected.
- The RX 5500 XT is designed to compete in the $150-250 market place and be a 1080p powerhouse. This put the RX5500 XT in line with the GTX 1600 series. Unfortunately, I do not have any GTX 1600 series cards to test against. This is why you don’t see it on the charts. As we get more GPUs, the GPU list will grow and they will be placed accordingly.
Synthetic Tests
3DMark Firestrike from Futuremark is a Semi-synthetic DirectX11 benchmark designed for high-performance gaming PCs. Firestrike performs advanced geometry, illumination and particle tests with its Graphics benchmark and performs physics simulations using the CPU. Firestrike Ultra Kicks it up a notch and ratchets up the resolution to 4K and turns the quality up a bit.
AMD has never claimed the RX 5500 XT was going to perform well above 1080p resolution. However, to keep in line with the rest of the testing, I ran Firestrike Ultra against the card anyway. The overall score came in at 3512 with a graphics score of 3488.
TimeSpy Extreme is another brutal 4K test much like Firestrike Ultra. The RX 5500 XT scored 2326 overall with a 2128 graphics score.
VR Mark Orange room is designed to test systems that meet the recommended hardware requirements for VR utilizing the Oculus Rift or HTC Vive. The Radeon RX 5500 XT did well here with an average frame rate of 158.66 frames per second and an overall score of 7278.
VR Mark Cyan Room is designed to test DirectX 12 and VR. This test is a bit more demanding than the Orange Room test above. The Radeon RX 5500 XT was able to maintain an average of 111 frames per second with an overall score of 5116.
VR Mark Blue Room leverages higher resolution for upcoming or new headsets using 5K. This is a brutal test on most GPUs. The RX 5500 XT only averaged 29 frames per second during the test and scored 1330 overall.
During our briefings on the RX 5500 XT, I don’t recall AMD stating either way on VR. However, based on the Orange Room test, I’d say there’s a good chance the RX 5500 XT would run most VR games decent enough with the image quality settings tuned appropriately.
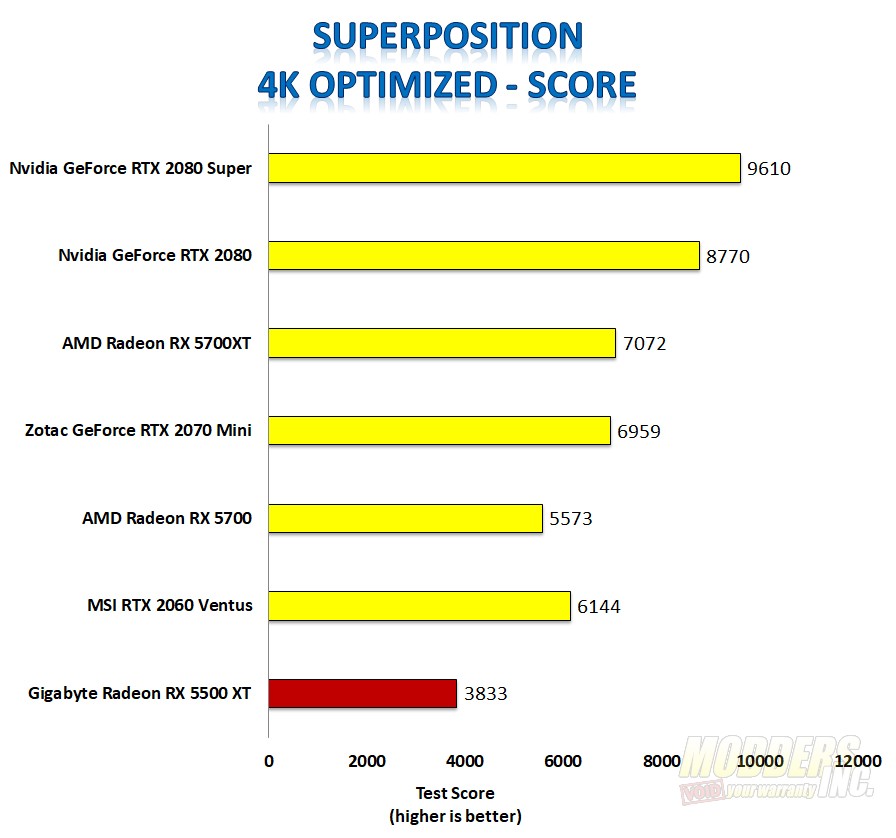
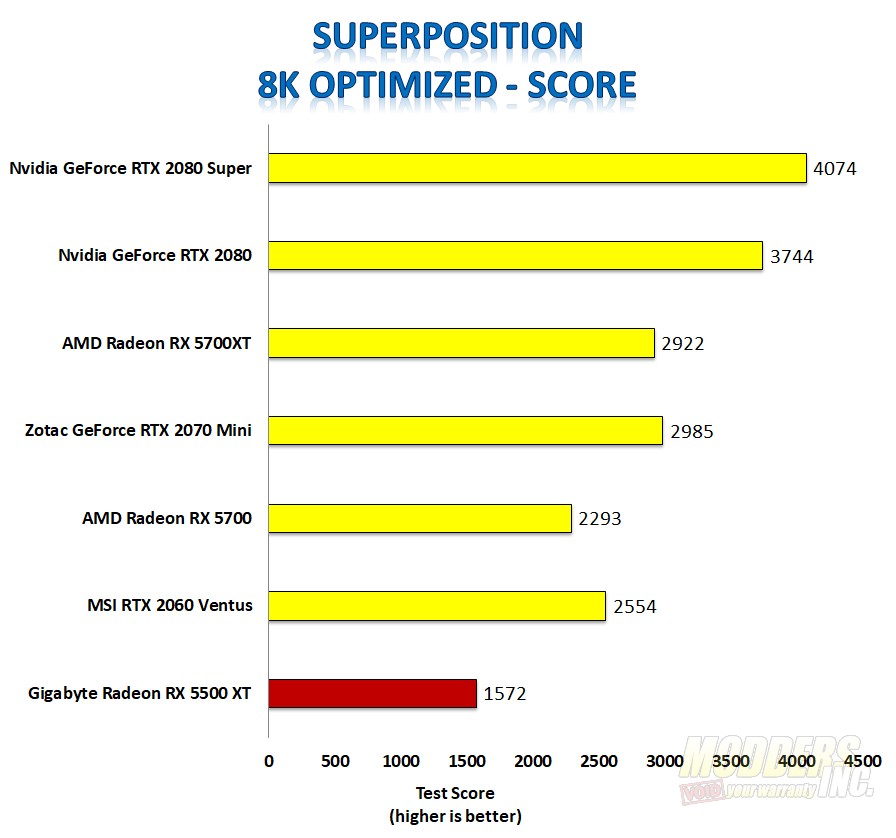
Unigine’s Superposition features both a monitor benchmark but also a VR load as well. I used the 4K optimized and 8K optimized presets. Superposition also allows you to explore the environment in VR Mode with your headset connected.
Superposition is a beautiful benchmark. The Radeon RX 5500 XT received a combined score of 3833.
At twice the rendering resolution of the previous test, the Radeon RX 5500 XT scores 1572 in the 8K test.
Check Out Our Amazon Store with Modders Inc
Please Support PCTestBench as Every Purchase Helps