All testing was done with both the CPU (9700k) and GPU at their stock settings. For the I7 9700k, it was left at its stock speed of 3.6 GHz. Although the base clock is 3.6 GHz, the I7-9700k can boost up to 4.9 GHz. In the case of our I7-9700k, it boosts between 4.7 GHz and 4.9 GHz. Usually, the I7-9700k used in this review runs at a consistent 4.7 GHz. Ambient temperature is kept as close to 20°c (68°f) as possible. When the system was first turned on, it sat idles for about 30 minutes or so before any benchmarks were run or results recorded. We waited in between each benchmark no less than 30 minutes to give the system time to cool down a bit. Being an open-air system, it does cool down pretty quickly. The I7-9700k used in this review is water-cooled on a custom loop and the GPU used its stock air cooler. The block is the EK Velocity water block. There is a single 360 x 60 mm EK radiator in the loop and a 280 ml reservoir and a D5 pump.
| Component |
Product Name | Provided By |
| Processor | Intel Core I7-9700k | Retail Purchase |
| Motherboard | Z390 AORUS Pro | Gigabyte |
| Memory | 16 GB AORUS RGB Memory 3200 MHz CAS 16 (2 x 8GB) | Gigabyte |
| Drive | Crucial P1 500 GB NVMe M.2 SSD | Crucial |
| Video Card | Gigabyte Geforce GTX 1660 Super Gaming OC 6G | Gigabyte |
| Monitor | LG 27UL500-W 27″ 3840×2160 @ 60 Hz | Retail Purchase |
| Case | Thermaltake Core P5 | Retail Purchase |
| Power Supply | 1600 Watt EVGA SuperNova Ps 80+ Platinum Power Supply | EVGA |
| Operating System | Windows 10 x64 Pro with latest patches and updates |
For games, we test eight titles. The games we test are Battlefield V, Deus Ex: Mankind divided, Far Cry 5, Final Fantasy XV, Ghost Recon: Wildlands, Shadow of the Tomb Raider, Shadow of War and the Witcher 3. Each game is tested in three resolutions. These resolutions are 1080p, 1440p and 4k. The benchmarks are run three times and each run is three minutes long. The final result is the average of the three runs. Games are played on a 27″ LG 4k 60 Hz monitor. For synthetic benchmarks, we used the following; 3DMARK Time Spy Extreme, 3DMARK Firestrike Ultra, VRMARK Orange Room, VRMARK Cyan Room, VRMARK Blue Room, and Unigine Superposition. In Superposition, we ran the 4k Optimized and 8K Optimized tests.
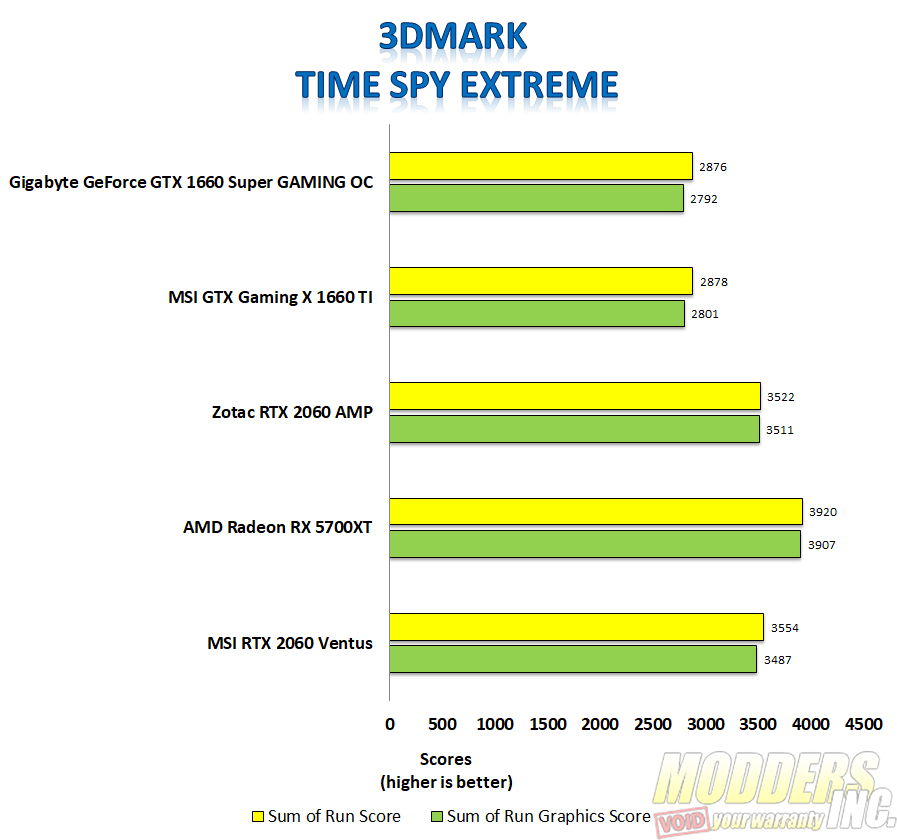
For comparison, we’ve added in our results doe the MSI Gaming X 1660 TI, The Zotac RTX 2060 AMP, AMD Radeon RX 5700XT, and the MSI RTX 2060 Ventus. Now, keep in mind, the other cards were tested on different drivers, and some with a different processor, the I7-8700k instead of the I7-9700k which we recently switched to using on our standard test bench.
Synthetic Benchmarks
3DMARK is the go-to benchmark for all enthusiasts. It covers tests for everything from tablets and notebooks to gaming laptops and the most powerful gaming machines. For this review, we ran both Time Spy Extreme and Firestrike Ultra. For the synthetic benchmarks, we still run each benchmark three times. However, we just go with the best overall results out of the three, we do not average them out.
3DMARK Time Spy Extreme
Looking at the results for 3DMARK Time Spy Extreme, our Gigabyte 1660 Super achieved an overall score of 2876. This was only two points behind the overall score for the MSI Gaming X 1660 ti. OUr Gigabyte 1660 Super achieved a graphics score of 2792.
3DMARK Firestrike Ultra
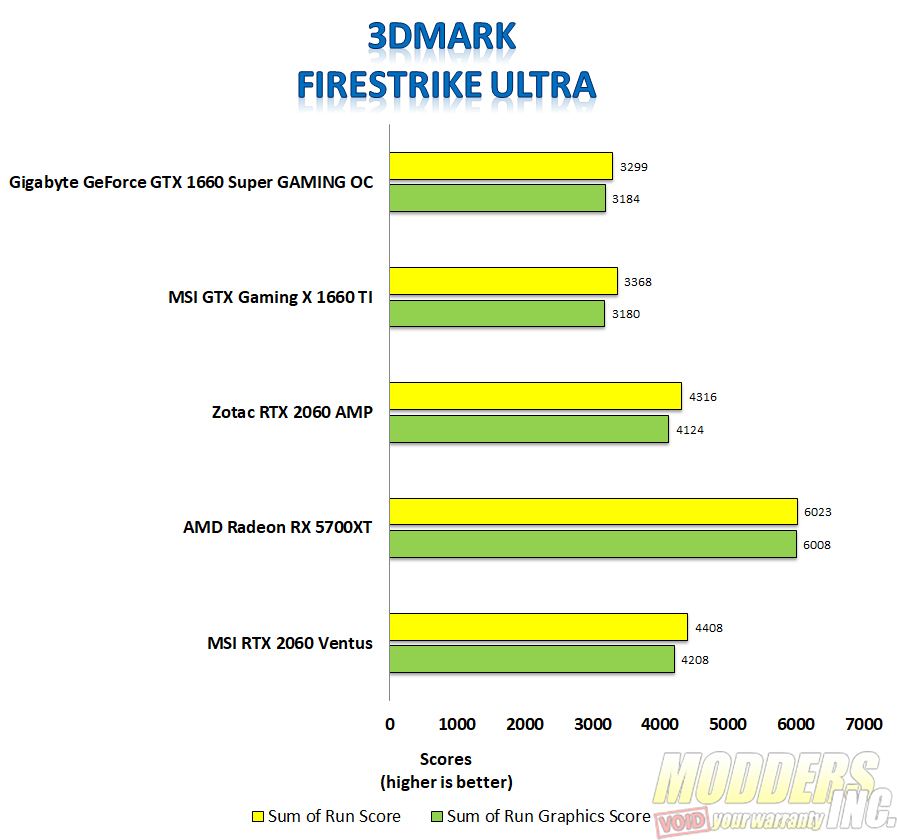
In 3DMARK Firestrike Ultra, our Gigabyte 1660 Super beat out its closest competitor in the MSI Gaming X 1660 ti in the graphics score, be it only by four points. The overall score eas 69 points behind the MSI Gaming X 1660 ti. Our Gigabyte 1660 Super came in with an overall score of 3299 in Firestrike Ultra.
VRMARK
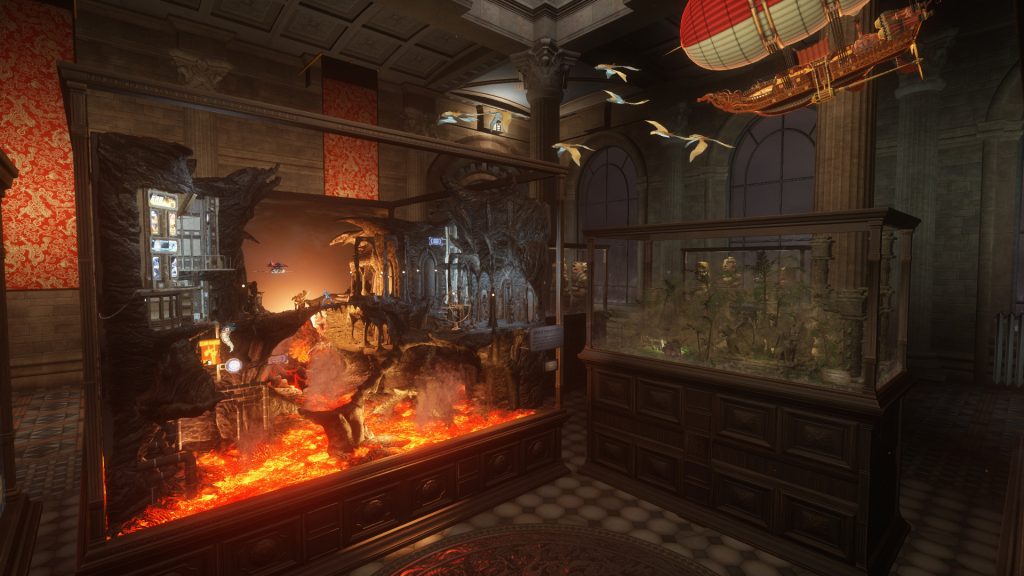
VR Mark consists of three separate tests, each more intensive on your system than the last. These tests are The Orange Room, the Cyan Room, and the Blue Room. The Orange Room test is the least intense and is meant to test a system that meets the minimum hardware requirements for VR Gaming. The Cyan Room shows the user how the use of an API with less overhead can provide the user with a great VR experience, even on less than amazing hardware. The Blue Room test is designed for the latest and greatest hardware. The Blue Room renders at a whopping 5k resolution and is designed to push your system to the limits for an amazing VR experience.
Orange Room
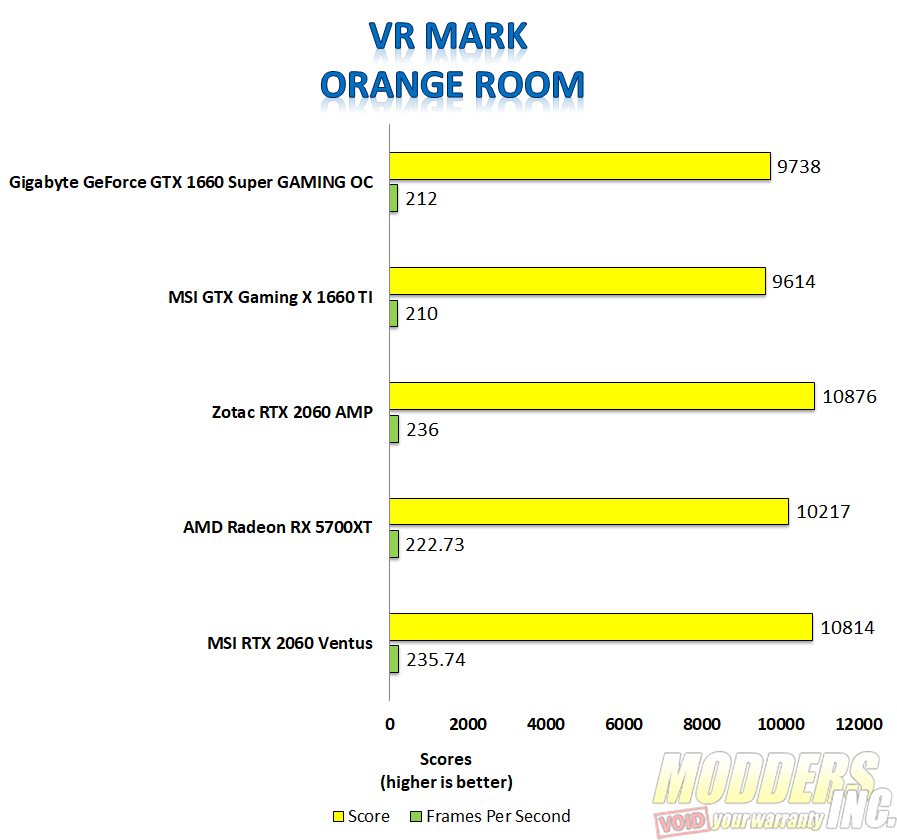
In the VRMARK Orange Room benchmark, our Gigabyte 1660 Super beat out the MSI Gaming X 1660 ti by an overall score of 9738 to 9615. On the average frames per second, the MSI Gaming X 1660 ti was again beat out by the Gigabyte 1660 Super 210 to 212.
Cyan Room
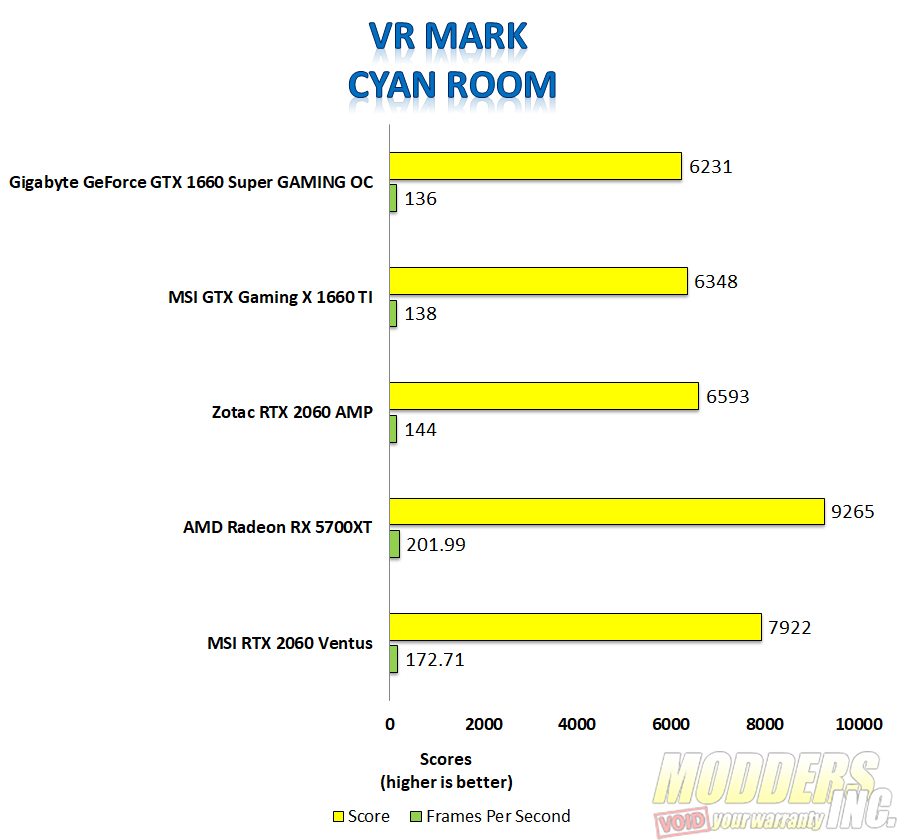
In the Cyan Room benchmark, our Gigabyte 1660 Super achieved an overall score of 6231 with an average frame rate of per second of 136.
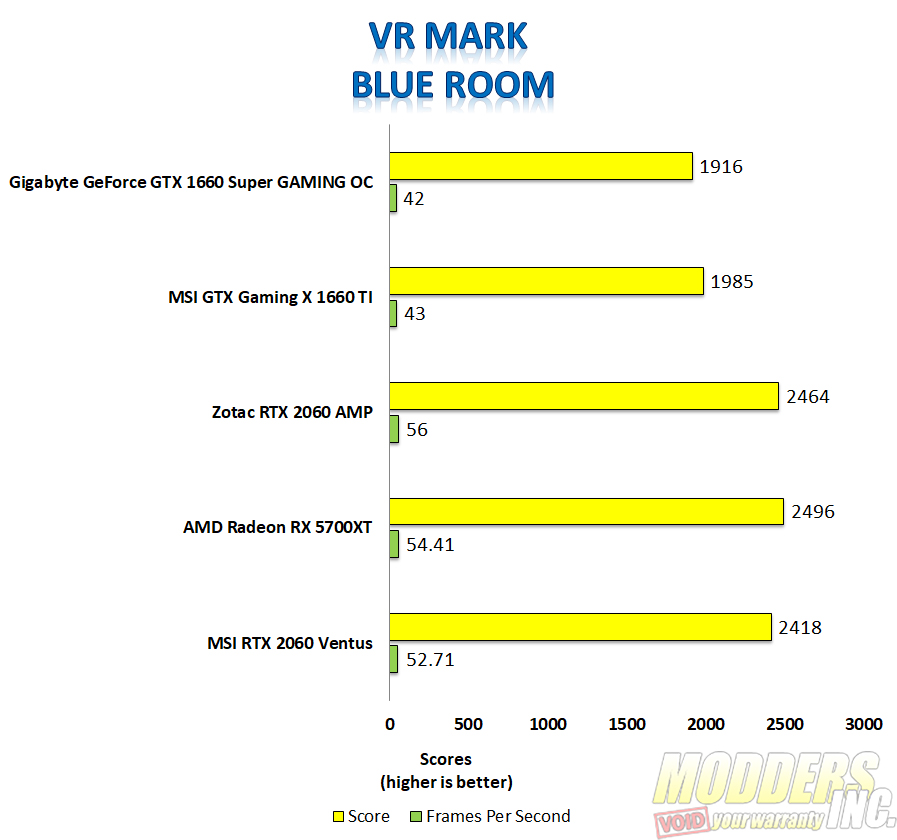
Blue Room
VRMARK Blue room is the most intense of the three VRMARK benchmarks. It’s designed more for higher-end systems designed for 4k gaming. The Gigabyte 1660 Super achieved an overall score of 1916 in VRMARK Blue Room with an average frame rate per second of 42.
Unigine Superposition
Superposition is another GPU intensive benchmark put out by Unigine, the makers of both the very popular Valley and Heaven benchmarks. Superposition is an extreme performance and stability test for graphics cards, power supplies, and cooling systems.
There are several tests in Unigine’s Superposition benchmark. For our graphics card reviews, we run both the 4K Optimized and 8K Optimized tests. Being the lowest end card of the five tested, it was no surprise the Gigabyte 1660 Super was at the bottom of the pack. In the 4k Optimized test, our Gigabyte 1660 Super scored 4169. In the 8k Optimized test, our Gigabyte 1660 Super achieved a score of 2041.



Check Out Our Amazon Store with Modders Inc
Please Support PCTestBench as Every Purchase Helps