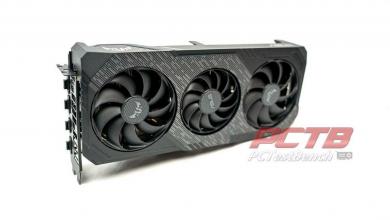
ASUS ROG Strix RTX 2080 TI Review
Synthetic Benchmarks
3DMark
3DMark is the go-to benchmark for all enthusiasts. It covers tests for everything from tablets and notebooks to gaming laptops and the most powerful gaming machines. For this review, we ran both Time Spy Extreme and Fire Strike Ultra. For the synthetic benchmarks, we still run each benchmark three times. However, we just go with the best overall results out of the three, we do not average them out.
Time Spy Extreme
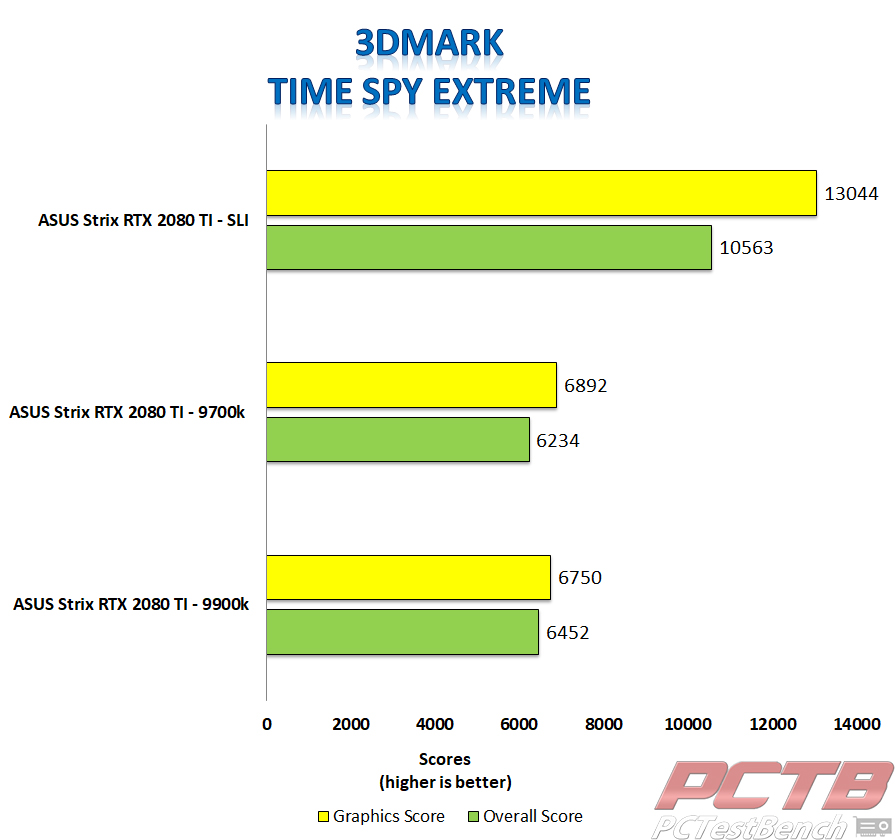
We ran Fire Strike Ultra and Time Spy Extreme on both the 9700K and 9900K systems, as well as in SLI on the 9900K system. In SLI, the Strix 2080 Ti achieved an overall score of 10563 in Time Spy Extreme and a graphics score of 13044. With a single card in 3DMark Time Spy Extreme, the 9900K system achieved an overall higher score. However, the Strix 2080 Ti achieved a higher graphics score on the 9700K system. On the 9900K system, the Strix RTX 2080 Ti achieved an overall score of 6452 and a graphics score of 6750. On the 9700K system, our Strix RTX 2080 Ti achieved an overall score of 6234 and a graphics score of 6892.
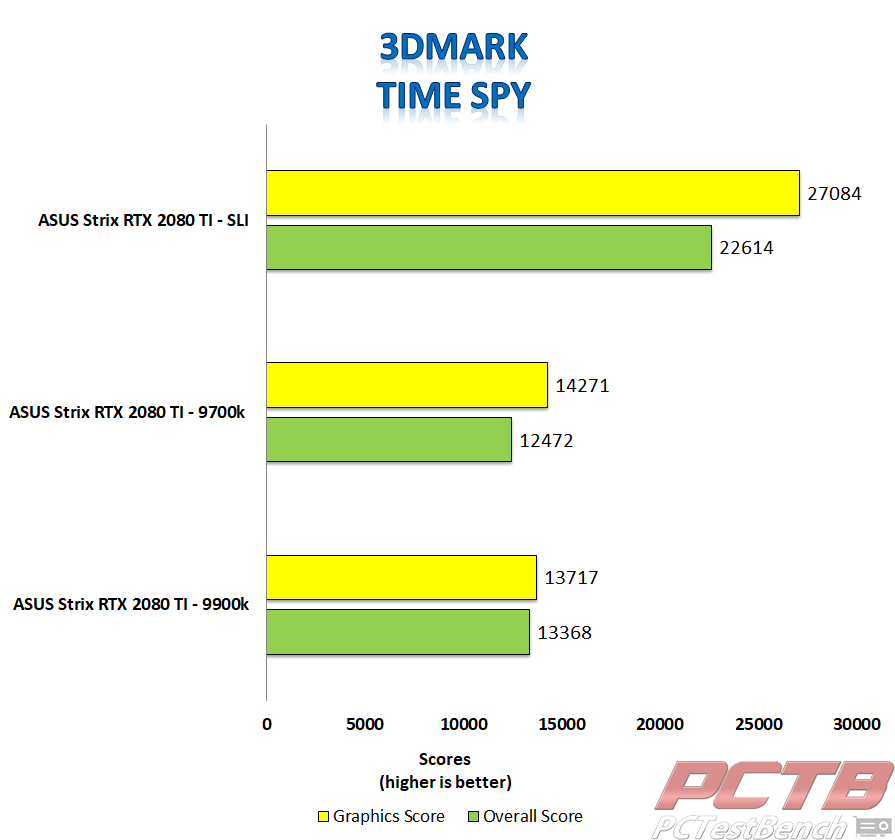
We decided to include both Time Spy and Fire Strike as they are two of the most popular benchmarks for graphics cards. In Time Spy, the Strix 2080 Ti achieved a better overall score on the 9900K system with a score of 13368. On the 9900K system, the Strix 2080 Ti scored 13717 on the graphics test. On the 9700K system, the Strix 2080 Ti achieved an overall score of 12472. However, the Strix 2080 Ti scored 14271 on the graphics test, beating out the 9900K system. In SLI, the Strix 2080 Ti scored 27084 on the graphics test and achieved an overall score of 22614.
Firestrike
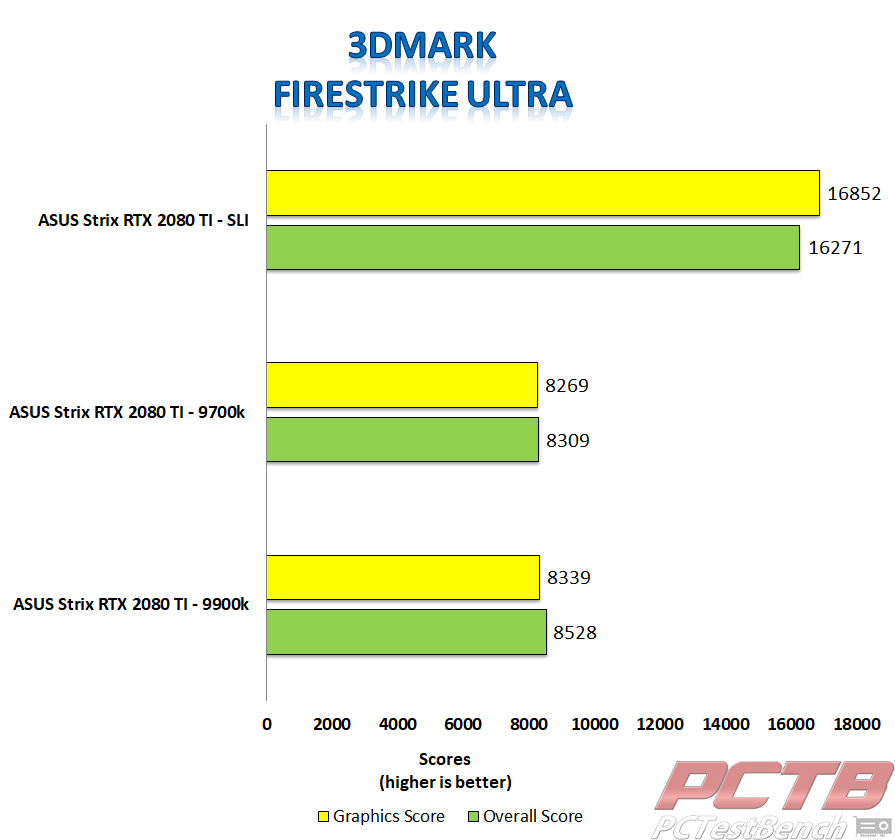
In 3D MARK Fire Strike Ultra, the Strix RTX 2080 Ti did slightly better running on out 9900K testbench. The overall score on the 9900K being 8528 and the graphics score was 8339. This is a bit higher than on our 9700K test system, but not that much higher. The Strix 2080 Ti achieved an overall score of 8309 and a graphics score of 8269. In SLI, our Strix 2080 Ti achieved an overall score of 16271 in Fire Strike Ultra and a graphics score of 16852.
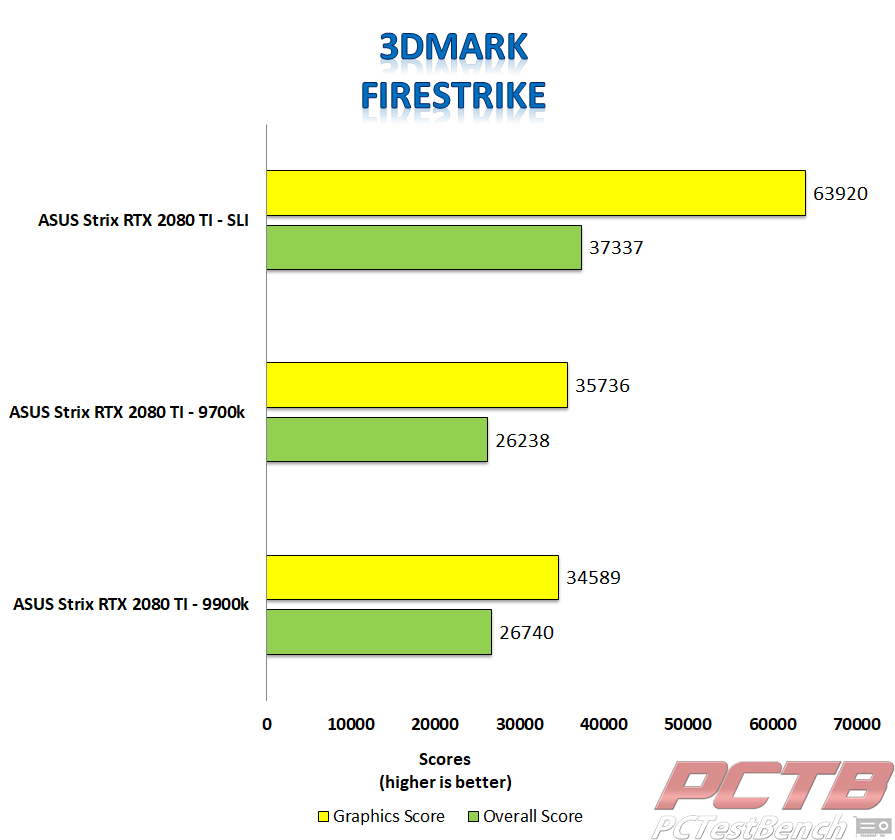
I have a lot of memories with Fire Strike, having run it nearly 400 times over the years. With the Strix 2080 Ti, I saw the highest scores I’ve ever seen in Fire Strike, or Time Spy as well. The Strix 2080 Ti did better on the overall score on the 9900K system with a score of 26740 and a graphics score of 34589. The Strix 2080 Ti did better on the graphics score with a score of 35736 and achieved an overall score of 26238. In SLI, The Strix 2080 Ti achieved an overall score if 37337 and a massive graphics score of 63920.
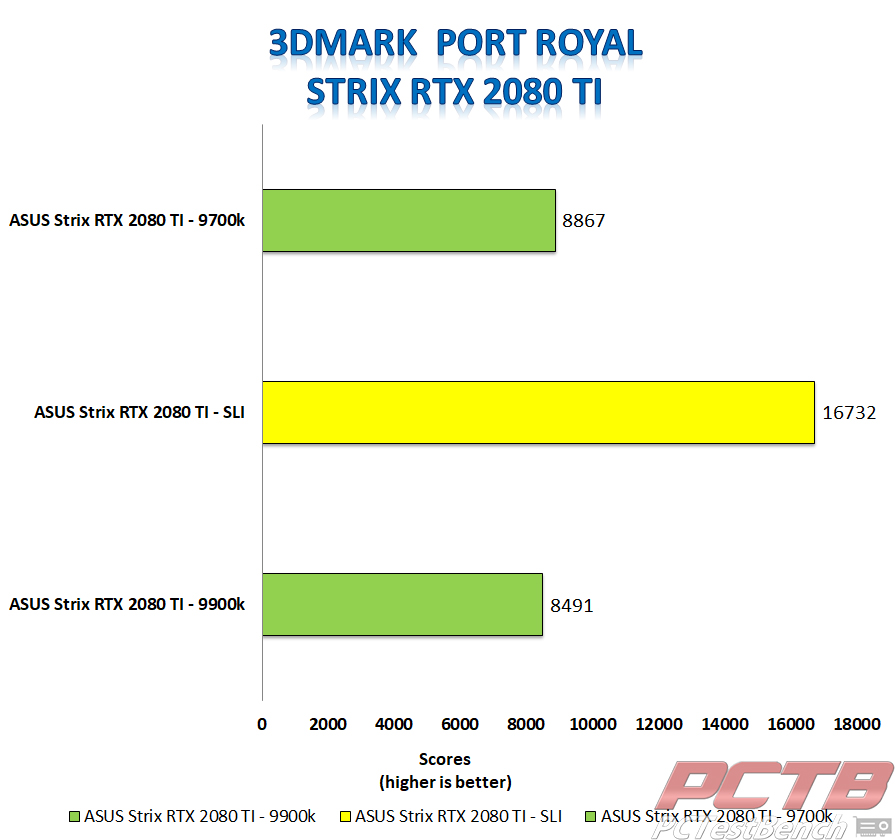
Port Royal was released in January of 2019 and is the world’s first real-time ray tracing benchmark and is part of the 3DMark suite of benchmarks. We ran the Port Royal benchmark on the 9700K system, 9900K system and in SLI on the 9900K system. The Stix 2080 Ti did better on the 9700K system with an overall score of 8867. On the 9900K system, the Strix 2080 Ti achieved an overall score of 8491 on a single card and 16732 in SLI.
VRMARK
VR Mark consists of three separate tests, each more intensive on your system than the last. These tests are The Orange Room, the Cyan Room, and the Blue Room. The Orange Room test is the least intense and is meant to test a system that meets the minimum hardware requirements for VR Gaming. The Cyan Room shows the user how the use of an API with less overhead can provide the user with a great VR experience, even on less than amazing hardware. The Blue Room test is designed for the latest and greatest hardware. The Blue Room renders at a whopping 5k resolution and is designed to push your system to the limits for an amazing VR experience.
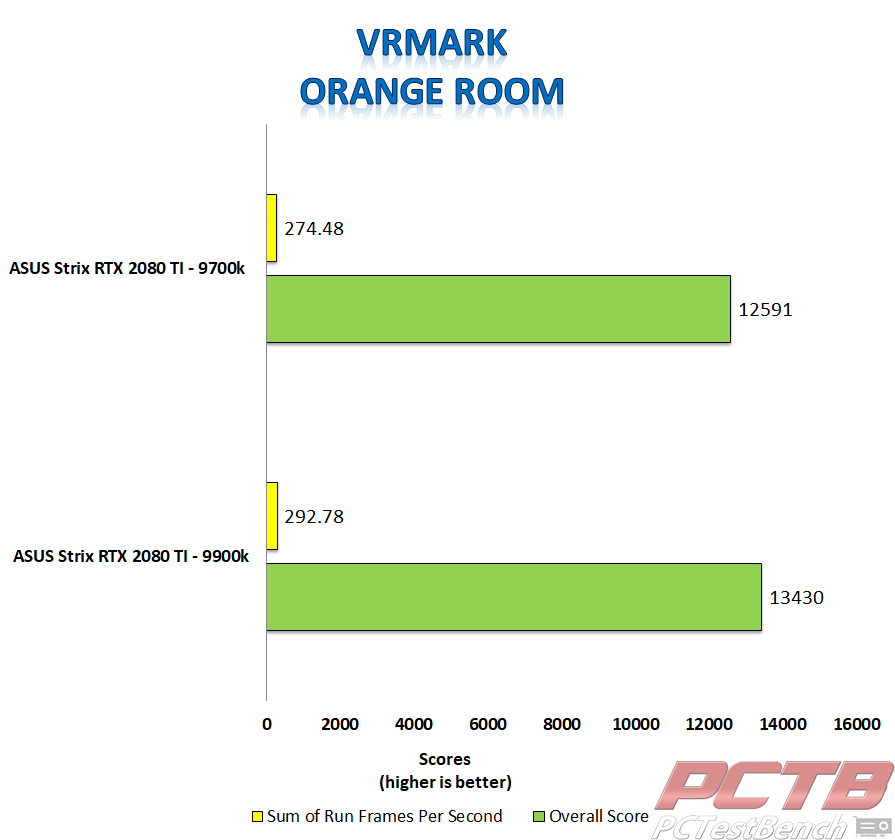
In VRMARK Orange Room, our Strix 2080 Ti did better on the 9900K system with an overall score of 13430 to the score of 12591 on the 9700K system.
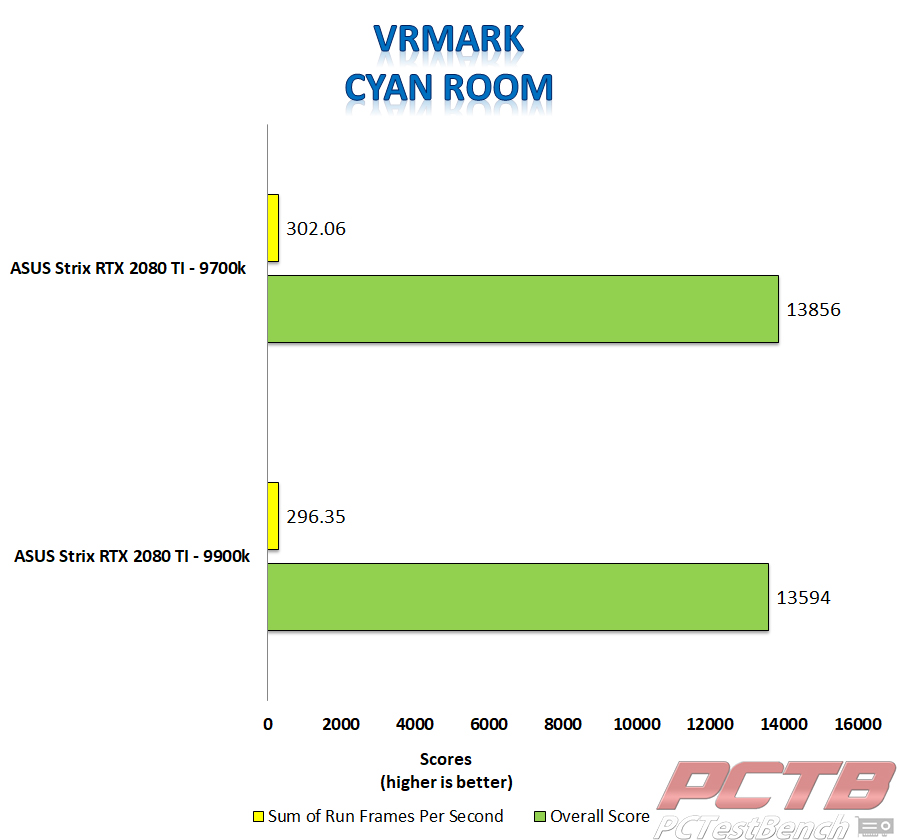
In VRMARK Cyan Room, our Strix 2080 Ti did slightly better on our 9700K system with a score of 13856 to a score of 13594 on our 9900K system.
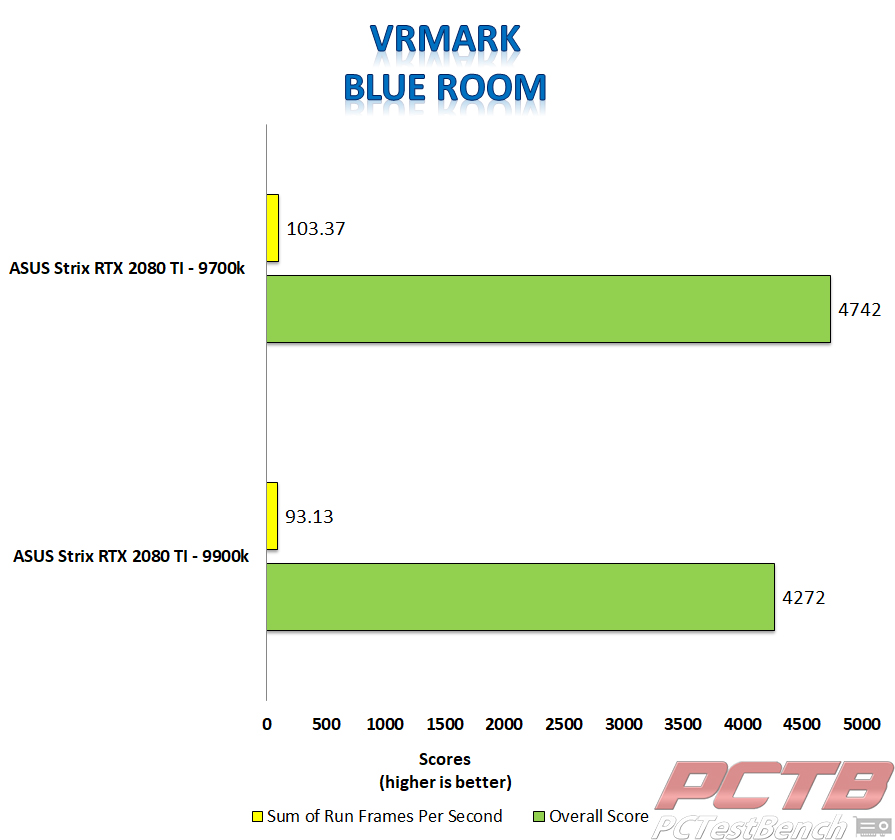
In VRMARK Blue Room, our Strix 2080 Ti did better on the 9700K system with a score of 4742 compared to the 9900K system that achieved an overall score of 4272.
Unigine Superposition
Superposition is another GPU intensive benchmark put out by Unigine, the makers of both the very popular Valley and Heaven benchmarks. Superposition is an extreme performance and stability test for graphics cards, power supplies, and cooling systems.
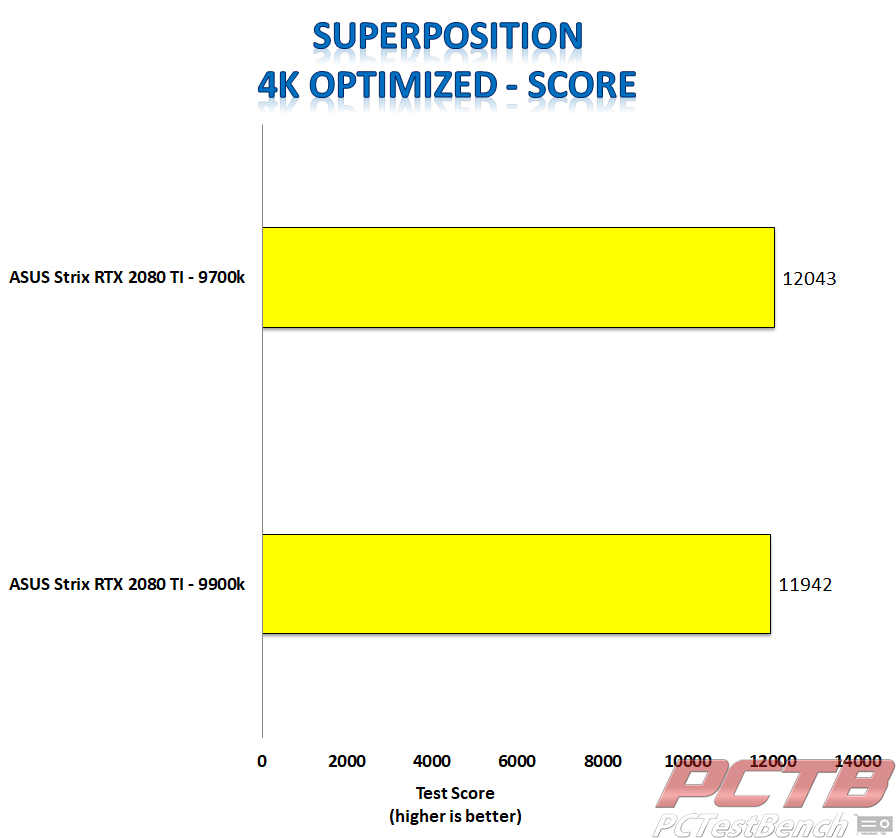
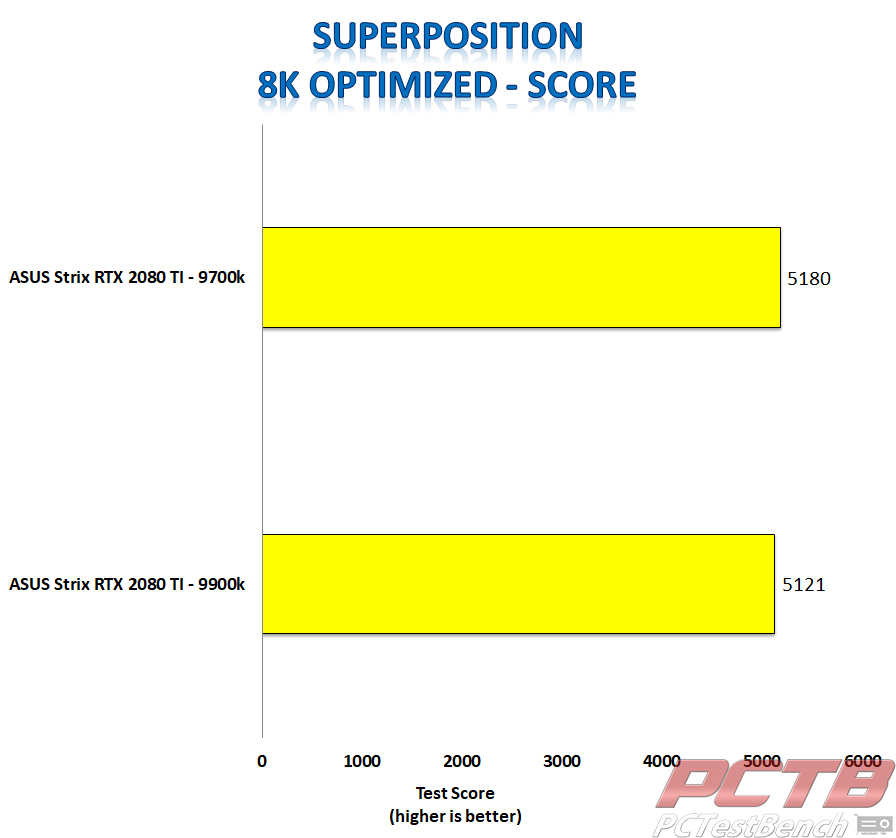
We ran both the 4K optimal and 8k optimal tests in Unigine Superposition. On both tests, our Strix RTX 2080 Ti did better on the 9700K system. On the 9700K system, the Strix 2080 Ti scored 12043 on the 4K optimized tests and 5180 on the 8k optimal test. On the 9900K system, the same card scored 11942 on the 4K optimal tests and 5121 on the 8k optimal test.
Unigine Heaven.

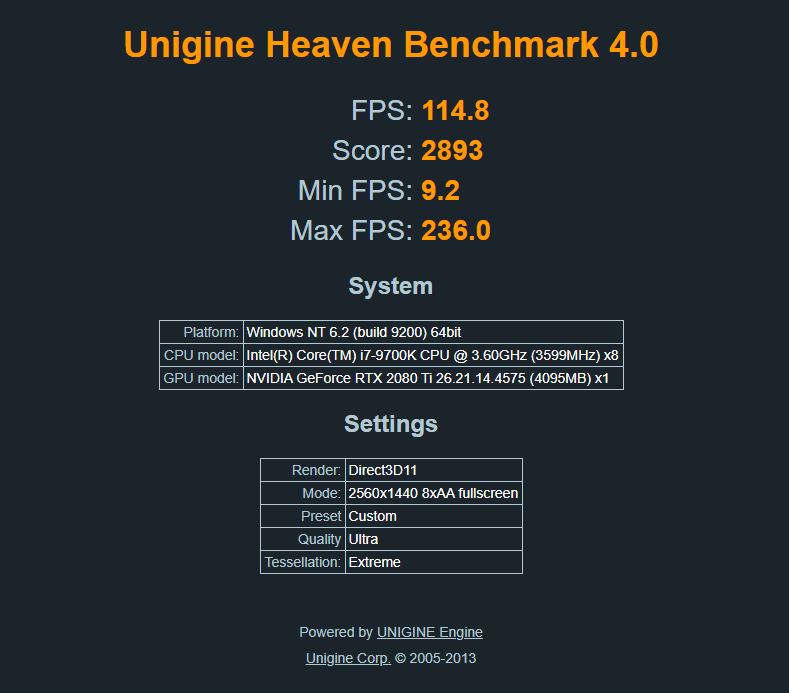
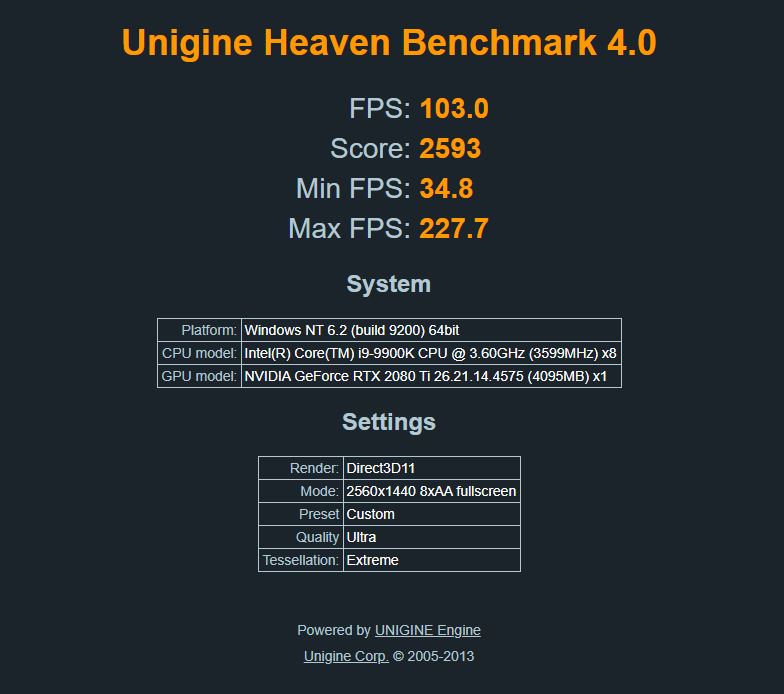
The Heaven Benchmark from Unigine is a DirectX 11 benchmark designed to stress your GPU under heavy loads. The Heaven Benchmark can be used to determine the stability of a GPU under extremely stressful conditions. I ran the heaven benchmark with the ASUS Strix 1080 Ti on a custom Preset, Ultra Quality, Extreme Tessellation, AA X8, in 2440 x 1440 resolution using the DX 11 API.
The heaven benchmark is an older benchmark, but one that most people are familiar with. On the 9700K system, the Strix 2080 Ti achieved an average frame rate of 114.8 FPS. The score on the 9700K system was 2893. This was slightly higher than the 9900K system. On the 9900K system, the Strix 2080 Ti averaged 103 frames per second and scored 2593 overall.
Blender
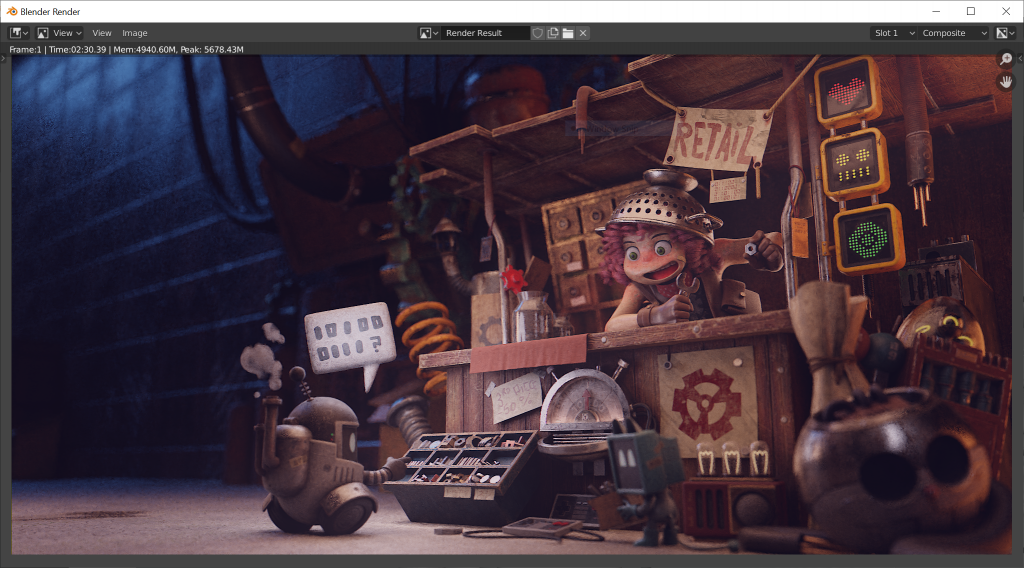
The Blender Benchmark is a testing suite aimed at the 3D software market professional. The Blender Benchmark computes performance for CUDA, OpenCL, and CPU, along with GPU performance. For Blender, we ran Blender 2.81, the Junk Shop render.
In Blender, the 9700K system rendered Blender 2.81, The Junk Shop image in 2 minutes and 30.39 seconds. With the 9900K system, the same image was rendered in 1 minute and 46.27 seconds.
FurMark
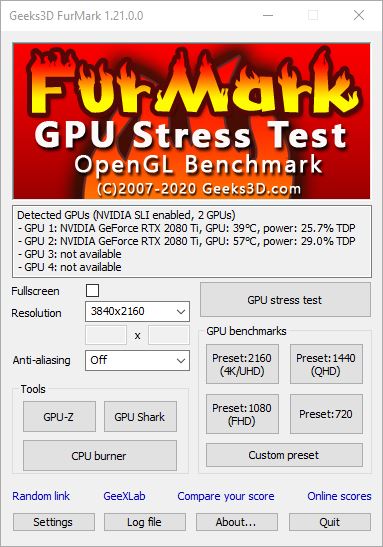
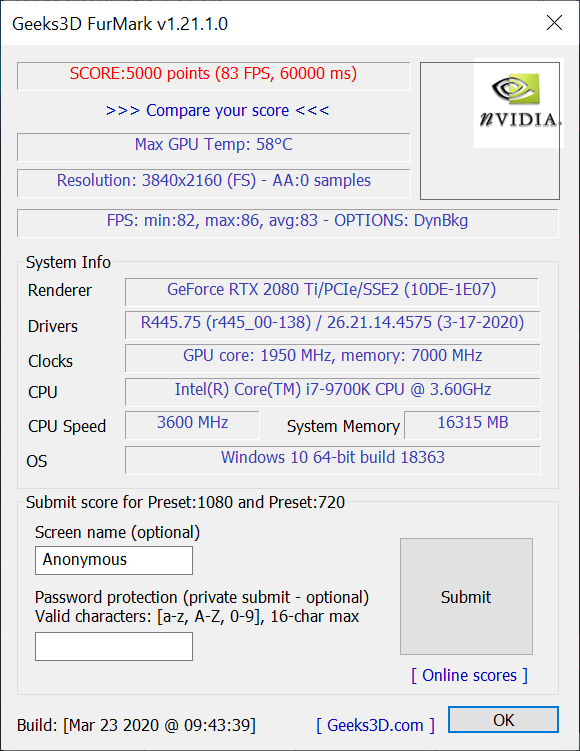
FurMark is a rather intensive OpenGL benchmark that uses fur rendering algorithms to measure the overall performance of your graphics card. Fur rendering is adapted to overheat your GPU. This makes FurMark a perfect stability test for validating the stability of GPU overclocks. FurMark has four presets when running the GPU Benchmark. The 720p preset, the 1080 (FHD) preset, the 1440 (QHD) preset and the 2160 (4K/UHD) preset. There is also a GPU Stress Test, which we used to validate GPU overclocks, and a custom setting section. For this review, we focused on the 2160 (4K/UHD) preset.
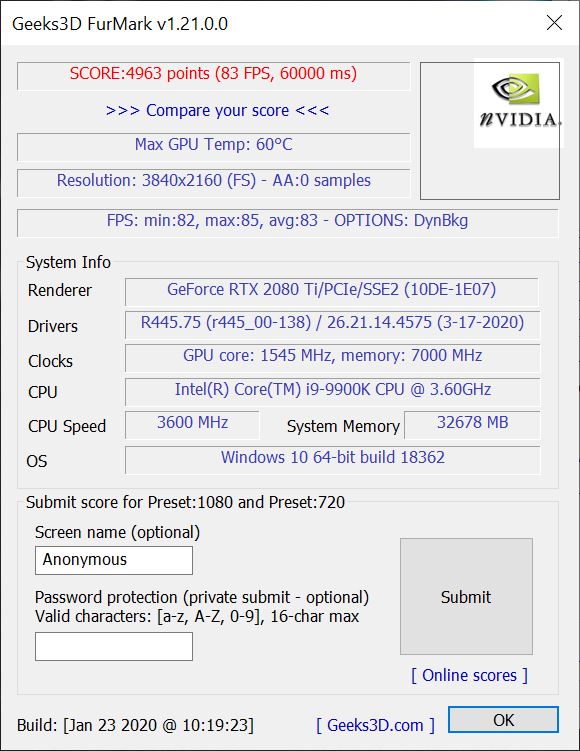
The 4K results in FurMark were very close on both systems. On the 9700K system, the Strix 2080 Ti averaged 83 FPS, with a minimum FPS of 82 and a maximum FPS of 86. The overall score on the 9700K system for the Strix 2080 Ti was an even 5000 points with a max GPU temperature of 58°C. On the 9900K system, the Strix 2080 Ti again averaged 83 FPS with a minimum of 82 FPS and a max frame rate of 85. The overall score on the 9900K system was 4963 points with a max temp of 60°C.
