ASUS ROG Maximus XII Hero Wi-Fi Z490 Motherboard
Loaded with renowned ROG features, Maximus XII Hero is ready to perform
Performance Testing
Test Platform:
CPU – Intel Core i9-10900K
Mobo – Asus ROG Maximus XII Hero
RAM – 32GB (4x8GB) HyperX Fury RGB 3200MHz C16
GPU – Nvidia RTX 2080 Founders Edition
SSD – Kingston KC1000 1TB
PSU – Thermaltake Toughpower Grand RGB Gold 750W
Chassis – Open BenchTable
Cooling – Custom Liquid Loop (EKWB Velocity CPU Block, EKWB PE240 Rad, 1x DDC Pump)
All testing is performed at default settings except for enabling XMP (Profile 1: 3200MHz 16-18-18-38 1.35V).
General Performance Testing
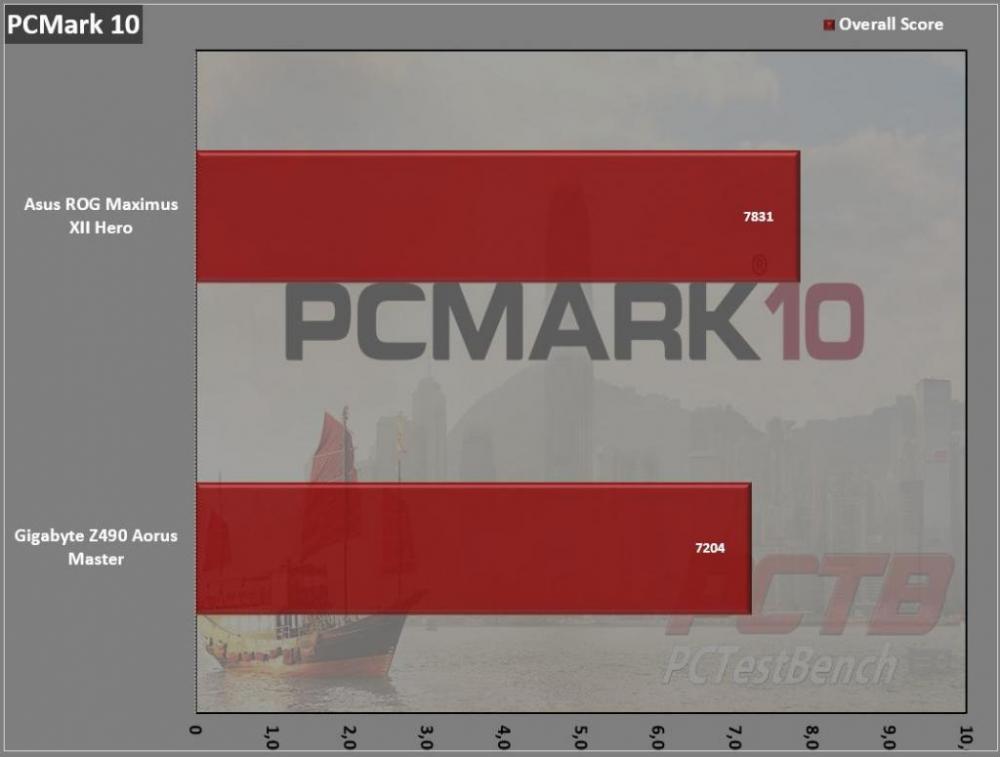
PCMark 10
PCMark 10 is the complete benchmark for the modern office. It is the ideal test for organizations that are evaluating PCs for a workforce with a range of performance needs. The tests in this benchmark cover a wide range of activities from everyday productivity tasks to demanding work with digital media content.
PCMark 10 uses a modular approach to build relevant benchmark tests around common end-user scenarios. A Test Group is a collection of workloads that share a common theme or purpose. There are four test groups in PCMark 10, we use three of them.
Essentials: covers the common, everyday ways that people use a PC. The workloads include Web Browsing, Video Conferencing, and App Start-up time.
Productivity: measures system performance with everyday office applications. This test group includes Spreadsheets and Writing workloads.
Digital Content Creation: This test group’s workload reflects the demands of working with digital content and media. The tests include Photo Editing, Video Editing, and Rendering and Visualization.
Asus pulls an easy lead here in overall score.
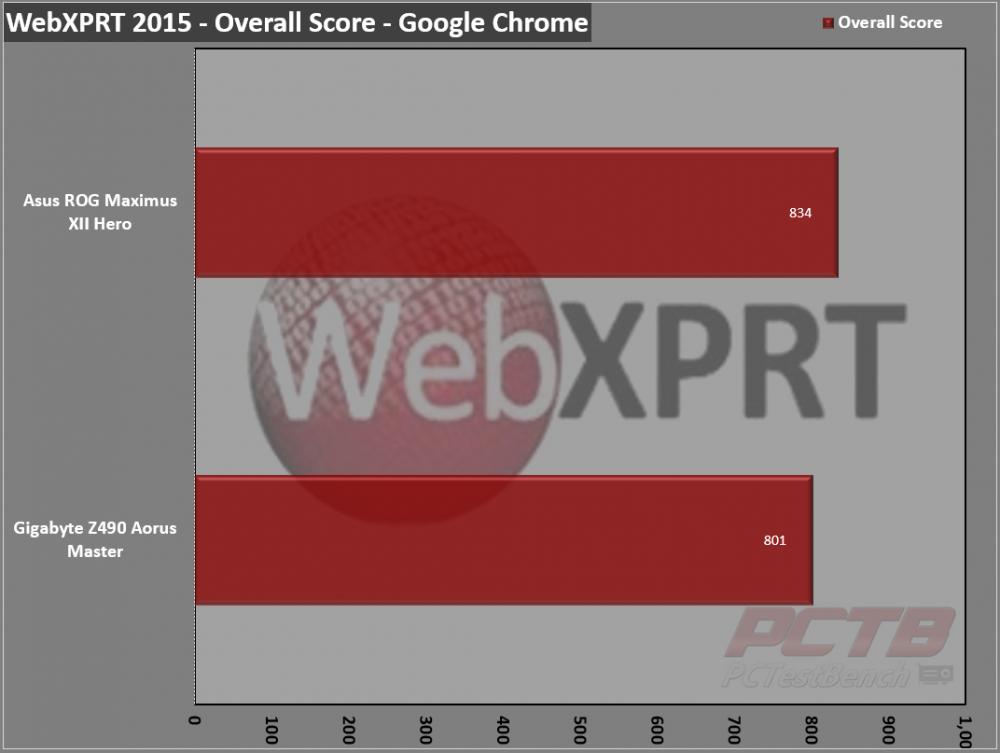
WebXPRT 2015
WebXPRT 2013 uses scenarios created to mirror the tasks you do every day to compare the performance of almost any Web-enabled device. It contains four HTML5- and JavaScript-based workloads: Photo Effects, Face Detect, Stocks Dashboard, and Offline Notes. WebXPRT is run with the latest stable release version of Google Chrome browser, in this case, Version 61.
Asus also pulls a slight lead in this browser-based test.
CPU Performance Testing
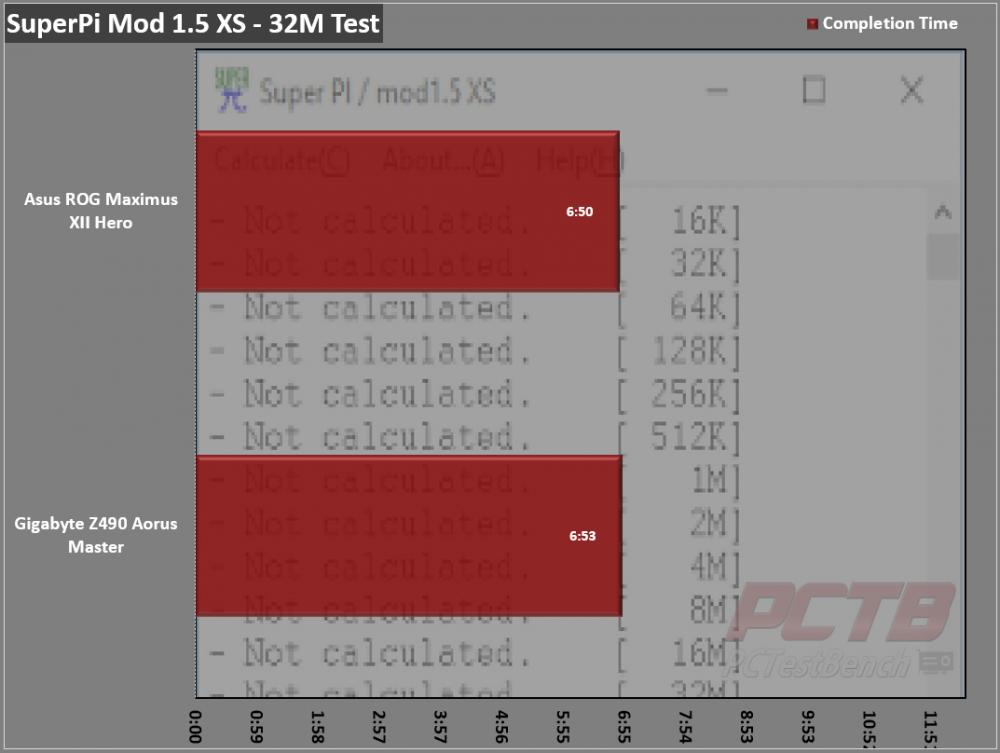
Super PI Modded 1.5
“In August 1995, the calculation of pi up to 4,294,960,000 decimal digits was succeeded by using a supercomputer at the University of Tokyo. The program was written by D.Takahashi in collaboration with Dr.Y.Kanada at the computer center. This record should be the current world record. (Details are shown in the windows help.) This record-breaking program was ported to personal computer environments such as Windows NT and Windows 95. In order to calculate 33.55 million digits, it takes within 3 days with a Pentium 90 MHz, 40 MB main memory, and 340 MB available storage.”
Asus manages to shave a few seconds off the SuperPi 32M solve time a scant 6 minutes and 50 seconds.
CINEBENCH R15
“CINEBENCH is a real-world cross-platform test suite that evaluates your computer’s performance capabilities. CINEBENCH is based on MAXON’s award-winning animation software CINEMA 4D, which is used extensively by studios and production houses worldwide for 3D content creation. MAXON software has been used in blockbuster movies such as Iron Man 3, Oblivion, Life of Pi or Prometheus, and much more.
CINEBENCH is the perfect tool to compare CPU and graphics performance across various systems and platforms (Windows and OS X). And best of all: It’s completely free.”
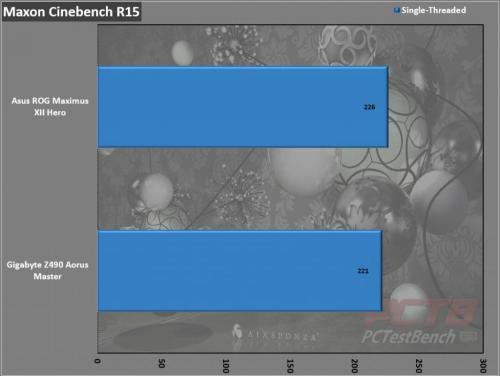
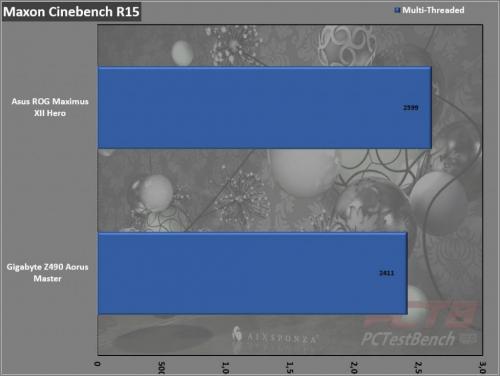
In Cinebench R15, Asus’s ROG Maximus XII Hero holds a 5-point lead in single-threaded testing, but that gap widens with all cores working.
CINEBENCH R20
Cinebench is a real-world cross-platform test suite that evaluates your computer’s hardware capabilities. Improvements to Cinebench Release 20 reflect the overall advancements to CPU and rendering technology in recent years, providing a more accurate measurement of Cinema 4D’s ability to take advantage of multiple CPU cores and modern processor features available to the average user. Best of all: It’s free.
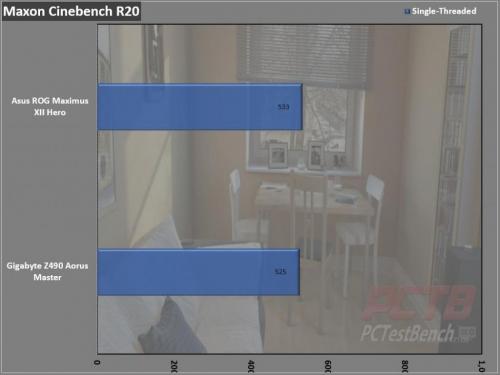
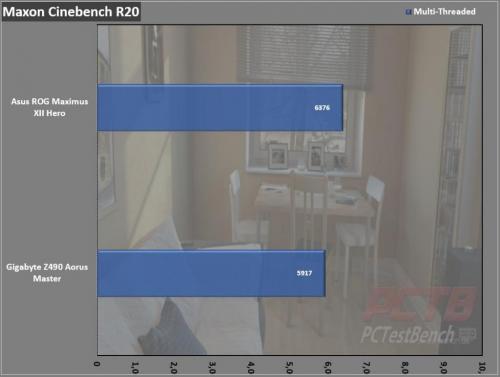
Cinebench R20 shows a similar pattern with a 7 and 459 point spread respectively.
Passmark Performance Test – CPU Mark
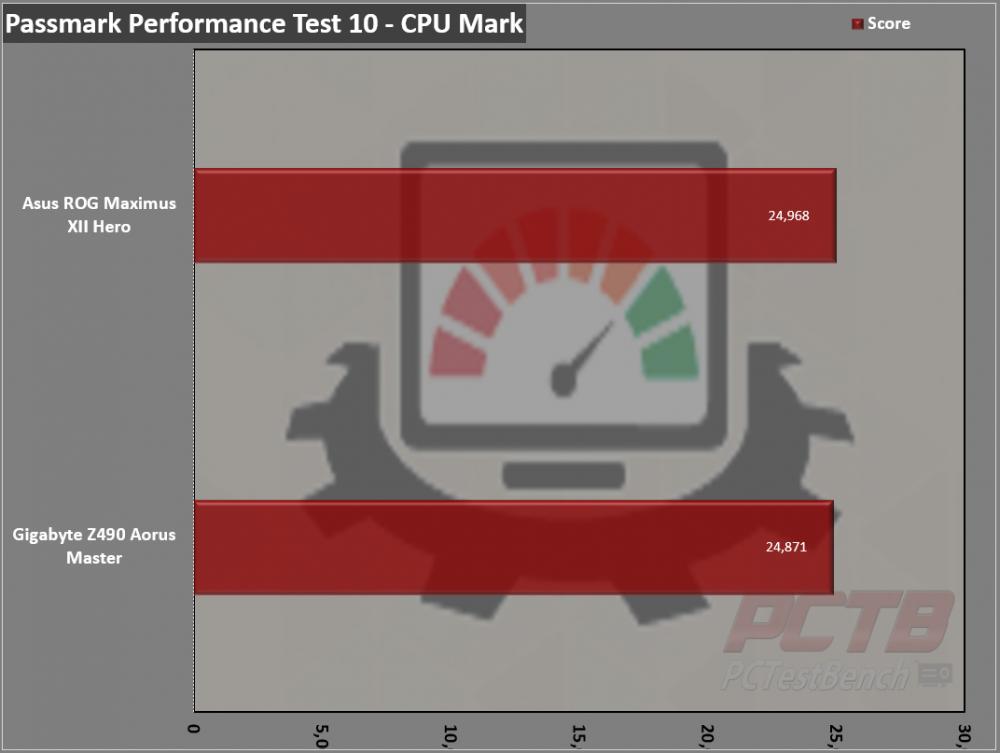
“Fast, easy to use, PC speed testing, and benchmarking. PassMark Performance Test ™ allows you to objectively benchmark a PC using a variety of different speed tests and compare the results to other computers.”
Passmark’s Performance Test 10 lends a very narrow 97 point lead to the Maximus XII Hero.
SiSoft Sandra – Cryptographic Bandwidth
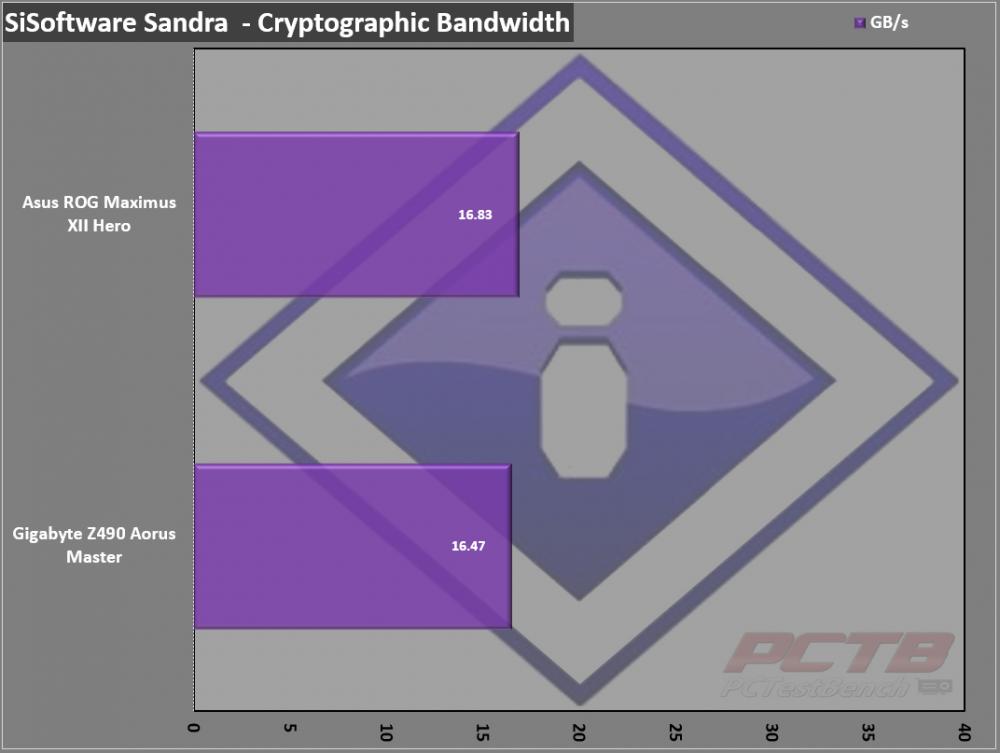
“SiSoftware Sandra provides a robust package of diagnostic tools for testing your system and teasing out its problems–or potential headaches.”
Asus again holds a narrow lead here.
Black Hole 4.2
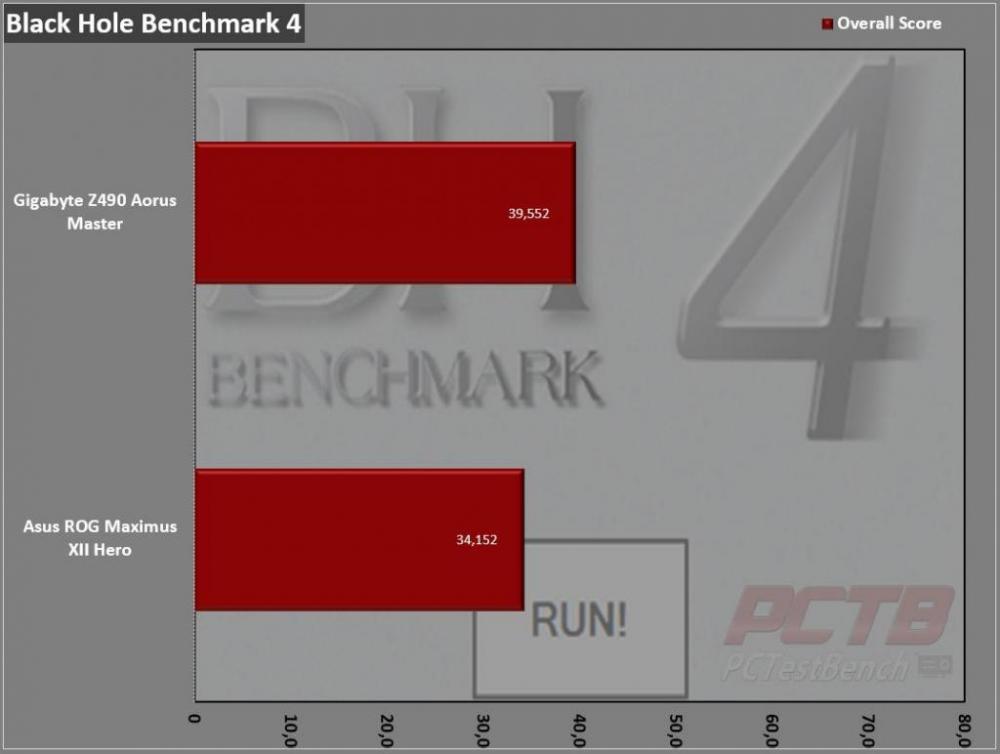
Let the beast run and benchmark your system in three different tests (Multithreaded, Single-threaded & 4-Threaded) that will test your CPU to the very limit, and score you among hundreds of other systems that have tested.
Multithreaded will test your CPU’s efficiency of running more than one thread without major system lag. The higher you score on this one, the more threads your CPU can handle with a comfortable speed. High multithreaded scores generally mean you can render things faster.
4-Threaded tests your CPU’s performance in games since most games currently run on 4 threads.
Single-threaded evaluates how fast the CPU can handle a single, dedicated thread for processing.
The Black Hole benchmark strongly favors the Gigabyte Z490 board here over Asus’s ROG Maximus XII Hero.



Check Out Our Amazon Store with Modders Inc
Please Support PCTestBench as Every Purchase Helps